Scotch-Irish vs Kenyan Disability Age 35 to 64
COMPARE
Scotch-Irish
Kenyan
Disability Age 35 to 64
Disability Age 35 to 64 Comparison
Scotch-Irish
Kenyans
13.0%
DISABILITY AGE 35 TO 64
0.1/ 100
METRIC RATING
281st/ 347
METRIC RANK
11.4%
DISABILITY AGE 35 TO 64
39.2/ 100
METRIC RATING
184th/ 347
METRIC RANK
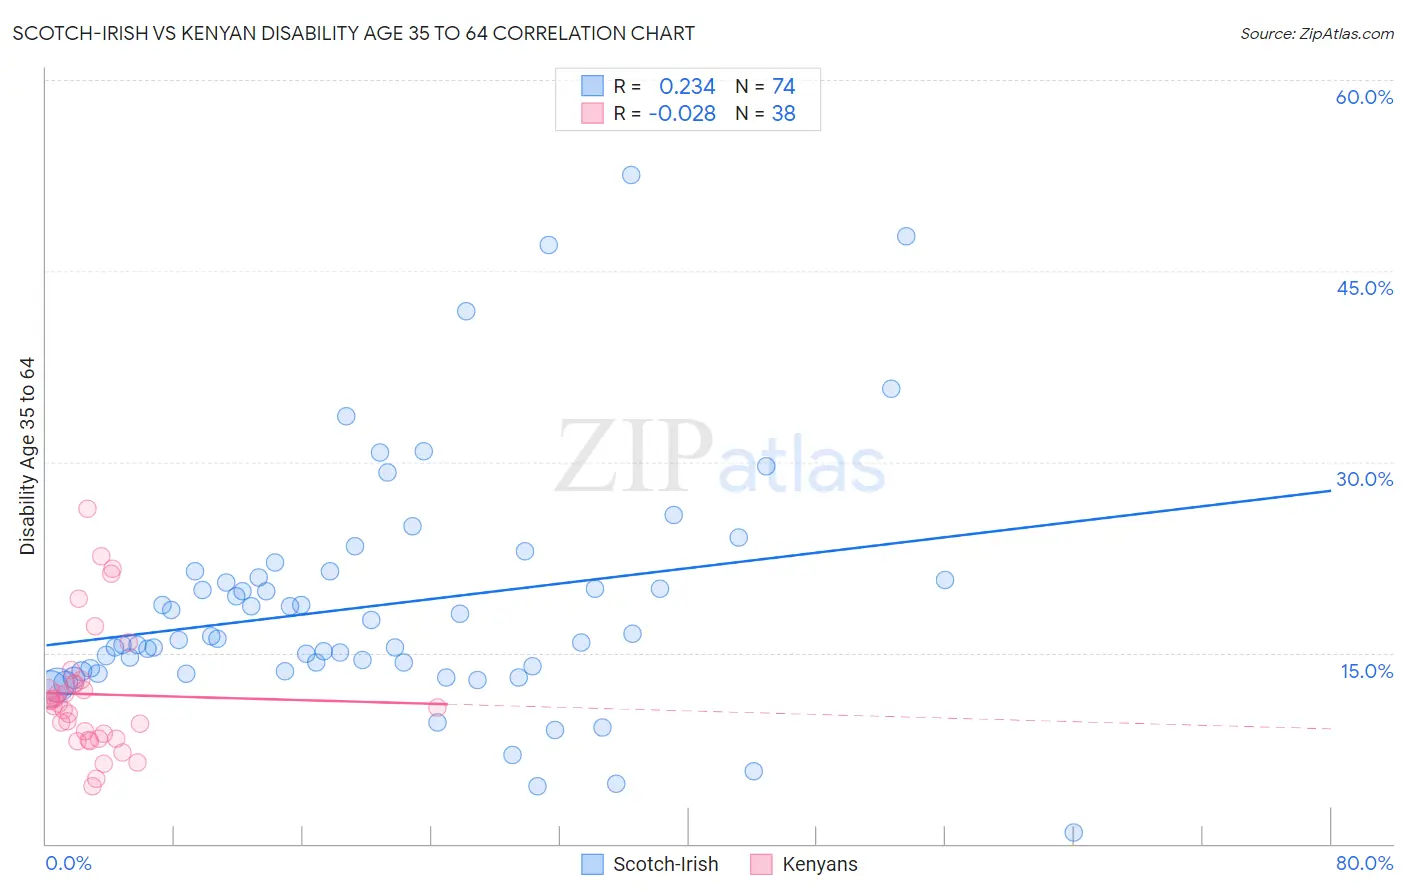
Scotch-Irish vs Kenyan Disability Age 35 to 64 Correlation Chart
The statistical analysis conducted on geographies consisting of 548,060,326 people shows a weak positive correlation between the proportion of Scotch-Irish and percentage of population with a disability between the ages 34 and 64 in the United States with a correlation coefficient (R) of 0.234 and weighted average of 13.0%. Similarly, the statistical analysis conducted on geographies consisting of 168,160,761 people shows no correlation between the proportion of Kenyans and percentage of population with a disability between the ages 34 and 64 in the United States with a correlation coefficient (R) of -0.028 and weighted average of 11.4%, a difference of 14.0%.
Disability Age 35 to 64 Correlation Summary
| Measurement | Scotch-Irish | Kenyan |
| Minimum | 0.87% | 4.5% |
| Maximum | 52.5% | 26.3% |
| Range | 51.7% | 21.8% |
| Mean | 18.7% | 11.7% |
| Median | 16.1% | 10.9% |
| Interquartile 25% (IQ1) | 13.6% | 8.2% |
| Interquartile 75% (IQ3) | 20.9% | 12.5% |
| Interquartile Range (IQR) | 7.3% | 4.3% |
| Standard Deviation (Sample) | 9.4% | 4.9% |
| Standard Deviation (Population) | 9.4% | 4.9% |
Similar Demographics by Disability Age 35 to 64
Demographics Similar to Scotch-Irish by Disability Age 35 to 64
In terms of disability age 35 to 64, the demographic groups most similar to Scotch-Irish are Immigrants from Laos (13.0%, a difference of 0.090%), Liberian (12.9%, a difference of 0.20%), Immigrants from Micronesia (12.9%, a difference of 0.36%), French Canadian (12.9%, a difference of 0.39%), and Immigrants from Dominican Republic (12.9%, a difference of 0.42%).
| Demographics | Rating | Rank | Disability Age 35 to 64 |
| Celtics | 0.1 /100 | #274 | Tragic 12.9% |
| Dominicans | 0.1 /100 | #275 | Tragic 12.9% |
| Somalis | 0.1 /100 | #276 | Tragic 12.9% |
| Immigrants | Dominican Republic | 0.1 /100 | #277 | Tragic 12.9% |
| French Canadians | 0.1 /100 | #278 | Tragic 12.9% |
| Immigrants | Micronesia | 0.1 /100 | #279 | Tragic 12.9% |
| Liberians | 0.1 /100 | #280 | Tragic 12.9% |
| Scotch-Irish | 0.1 /100 | #281 | Tragic 13.0% |
| Immigrants | Laos | 0.1 /100 | #282 | Tragic 13.0% |
| Central American Indians | 0.0 /100 | #283 | Tragic 13.0% |
| Immigrants | Nonimmigrants | 0.0 /100 | #284 | Tragic 13.0% |
| Immigrants | Somalia | 0.0 /100 | #285 | Tragic 13.1% |
| Hmong | 0.0 /100 | #286 | Tragic 13.1% |
| Tlingit-Haida | 0.0 /100 | #287 | Tragic 13.2% |
| Fijians | 0.0 /100 | #288 | Tragic 13.2% |
Demographics Similar to Kenyans by Disability Age 35 to 64
In terms of disability age 35 to 64, the demographic groups most similar to Kenyans are Immigrants from Oceania (11.4%, a difference of 0.030%), Icelander (11.4%, a difference of 0.040%), Trinidadian and Tobagonian (11.4%, a difference of 0.13%), Immigrants from Caribbean (11.3%, a difference of 0.19%), and Immigrants from Barbados (11.3%, a difference of 0.20%).
| Demographics | Rating | Rank | Disability Age 35 to 64 |
| Immigrants | Eastern Africa | 42.2 /100 | #177 | Average 11.3% |
| Poles | 42.0 /100 | #178 | Average 11.3% |
| Immigrants | Barbados | 41.6 /100 | #179 | Average 11.3% |
| Immigrants | Caribbean | 41.5 /100 | #180 | Average 11.3% |
| Trinidadians and Tobagonians | 40.8 /100 | #181 | Average 11.4% |
| Icelanders | 39.7 /100 | #182 | Fair 11.4% |
| Immigrants | Oceania | 39.5 /100 | #183 | Fair 11.4% |
| Kenyans | 39.2 /100 | #184 | Fair 11.4% |
| Danes | 36.8 /100 | #185 | Fair 11.4% |
| Slovenes | 36.6 /100 | #186 | Fair 11.4% |
| Immigrants | Bosnia and Herzegovina | 35.2 /100 | #187 | Fair 11.4% |
| Northern Europeans | 34.9 /100 | #188 | Fair 11.4% |
| Hungarians | 34.6 /100 | #189 | Fair 11.4% |
| Immigrants | Nigeria | 32.5 /100 | #190 | Fair 11.4% |
| Swedes | 31.3 /100 | #191 | Fair 11.4% |