Romanian vs Iranian Female Disability
COMPARE
Romanian
Iranian
Female Disability
Female Disability Comparison
Romanians
Iranians
11.9%
FEMALE DISABILITY
91.6/ 100
METRIC RATING
140th/ 347
METRIC RANK
10.6%
FEMALE DISABILITY
100.0/ 100
METRIC RATING
9th/ 347
METRIC RANK
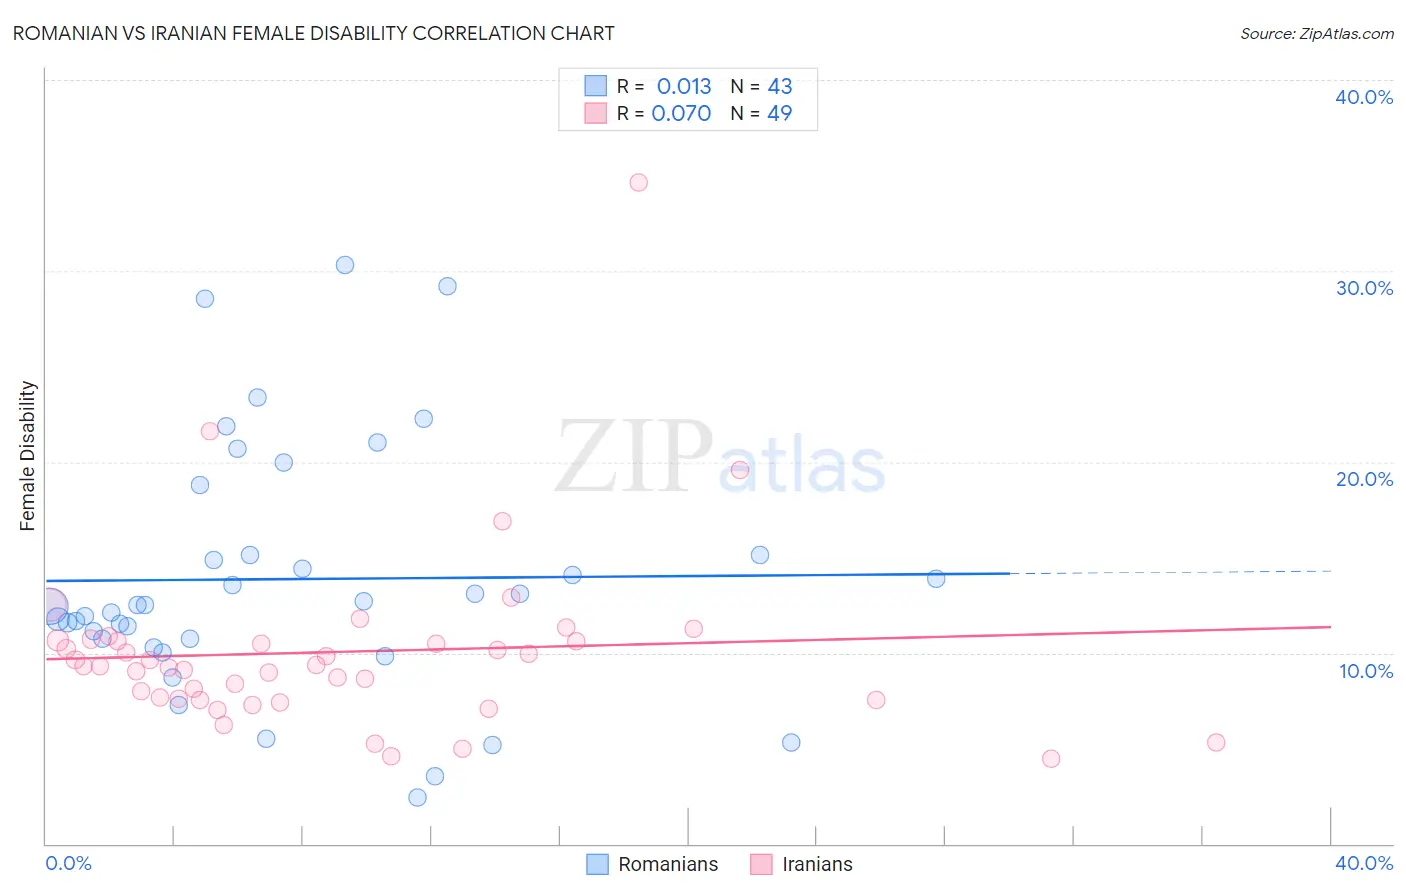
Romanian vs Iranian Female Disability Correlation Chart
The statistical analysis conducted on geographies consisting of 377,864,949 people shows no correlation between the proportion of Romanians and percentage of females with a disability in the United States with a correlation coefficient (R) of 0.013 and weighted average of 11.9%. Similarly, the statistical analysis conducted on geographies consisting of 316,876,376 people shows a slight positive correlation between the proportion of Iranians and percentage of females with a disability in the United States with a correlation coefficient (R) of 0.070 and weighted average of 10.6%, a difference of 13.0%.
Female Disability Correlation Summary
| Measurement | Romanian | Iranian |
| Minimum | 2.4% | 4.5% |
| Maximum | 30.3% | 34.6% |
| Range | 27.9% | 30.1% |
| Mean | 13.9% | 10.0% |
| Median | 12.5% | 9.3% |
| Interquartile 25% (IQ1) | 10.7% | 7.6% |
| Interquartile 75% (IQ3) | 15.2% | 10.6% |
| Interquartile Range (IQR) | 4.4% | 3.1% |
| Standard Deviation (Sample) | 6.5% | 4.8% |
| Standard Deviation (Population) | 6.4% | 4.8% |
Similar Demographics by Female Disability
Demographics Similar to Romanians by Female Disability
In terms of female disability, the demographic groups most similar to Romanians are Immigrants from Ecuador (11.9%, a difference of 0.020%), Immigrants from Hungary (11.9%, a difference of 0.16%), Immigrants from Africa (11.9%, a difference of 0.19%), Immigrants from Sudan (11.9%, a difference of 0.23%), and Ecuadorian (11.9%, a difference of 0.25%).
| Demographics | Rating | Rank | Female Disability |
| Kenyans | 94.5 /100 | #133 | Exceptional 11.9% |
| Immigrants | Nicaragua | 94.5 /100 | #134 | Exceptional 11.9% |
| Central Americans | 94.2 /100 | #135 | Exceptional 11.9% |
| Ugandans | 94.0 /100 | #136 | Exceptional 11.9% |
| Immigrants | Norway | 93.8 /100 | #137 | Exceptional 11.9% |
| Ecuadorians | 93.4 /100 | #138 | Exceptional 11.9% |
| Immigrants | Hungary | 92.8 /100 | #139 | Exceptional 11.9% |
| Romanians | 91.6 /100 | #140 | Exceptional 11.9% |
| Immigrants | Ecuador | 91.5 /100 | #141 | Exceptional 11.9% |
| Immigrants | Africa | 90.0 /100 | #142 | Excellent 11.9% |
| Immigrants | Sudan | 89.6 /100 | #143 | Excellent 11.9% |
| Immigrants | Austria | 87.9 /100 | #144 | Excellent 12.0% |
| Estonians | 87.8 /100 | #145 | Excellent 12.0% |
| Pakistanis | 84.6 /100 | #146 | Excellent 12.0% |
| Nigerians | 84.0 /100 | #147 | Excellent 12.0% |
Demographics Similar to Iranians by Female Disability
In terms of female disability, the demographic groups most similar to Iranians are Immigrants from Hong Kong (10.6%, a difference of 0.65%), Immigrants from Korea (10.6%, a difference of 0.82%), Immigrants from South Central Asia (10.5%, a difference of 0.91%), Immigrants from Singapore (10.4%, a difference of 1.1%), and Immigrants from Israel (10.7%, a difference of 1.2%).
| Demographics | Rating | Rank | Female Disability |
| Filipinos | 100.0 /100 | #2 | Exceptional 10.1% |
| Immigrants | Taiwan | 100.0 /100 | #3 | Exceptional 10.1% |
| Thais | 100.0 /100 | #4 | Exceptional 10.2% |
| Immigrants | Bolivia | 100.0 /100 | #5 | Exceptional 10.3% |
| Bolivians | 100.0 /100 | #6 | Exceptional 10.4% |
| Immigrants | Singapore | 100.0 /100 | #7 | Exceptional 10.4% |
| Immigrants | South Central Asia | 100.0 /100 | #8 | Exceptional 10.5% |
| Iranians | 100.0 /100 | #9 | Exceptional 10.6% |
| Immigrants | Hong Kong | 100.0 /100 | #10 | Exceptional 10.6% |
| Immigrants | Korea | 100.0 /100 | #11 | Exceptional 10.6% |
| Immigrants | Israel | 100.0 /100 | #12 | Exceptional 10.7% |
| Immigrants | Eastern Asia | 100.0 /100 | #13 | Exceptional 10.7% |
| Immigrants | China | 100.0 /100 | #14 | Exceptional 10.7% |
| Burmese | 100.0 /100 | #15 | Exceptional 10.7% |
| Okinawans | 100.0 /100 | #16 | Exceptional 10.8% |