Peruvian vs Immigrants from Sierra Leone Male Disability
COMPARE
Peruvian
Immigrants from Sierra Leone
Male Disability
Male Disability Comparison
Peruvians
Immigrants from Sierra Leone
10.4%
MALE DISABILITY
99.6/ 100
METRIC RATING
54th/ 347
METRIC RANK
10.5%
MALE DISABILITY
98.7/ 100
METRIC RATING
76th/ 347
METRIC RANK
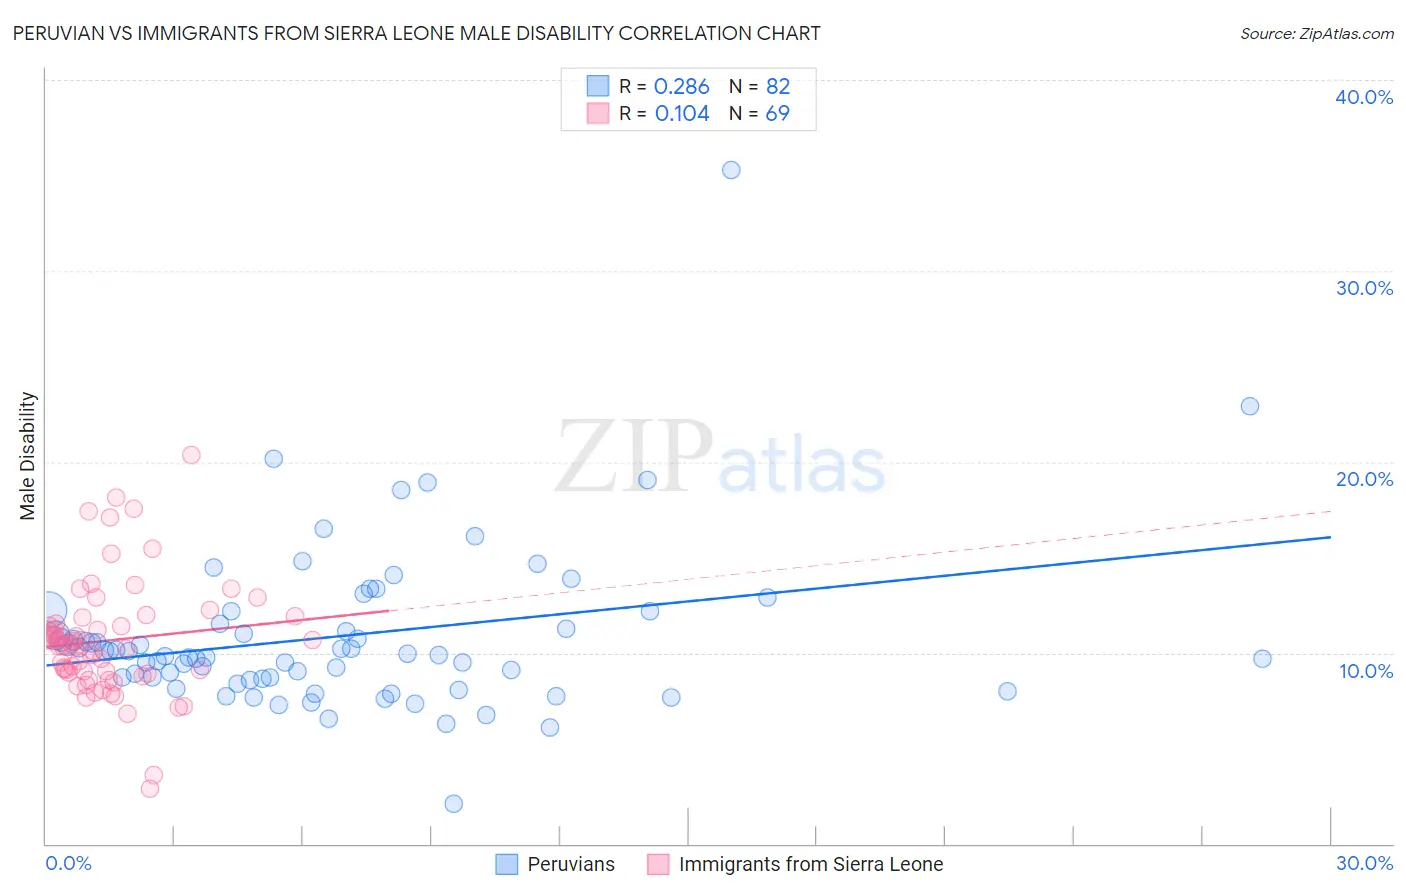
Peruvian vs Immigrants from Sierra Leone Male Disability Correlation Chart
The statistical analysis conducted on geographies consisting of 363,183,994 people shows a weak positive correlation between the proportion of Peruvians and percentage of males with a disability in the United States with a correlation coefficient (R) of 0.286 and weighted average of 10.4%. Similarly, the statistical analysis conducted on geographies consisting of 101,648,107 people shows a poor positive correlation between the proportion of Immigrants from Sierra Leone and percentage of males with a disability in the United States with a correlation coefficient (R) of 0.104 and weighted average of 10.5%, a difference of 1.7%.
Male Disability Correlation Summary
| Measurement | Peruvian | Immigrants from Sierra Leone |
| Minimum | 2.1% | 2.9% |
| Maximum | 35.3% | 20.4% |
| Range | 33.1% | 17.5% |
| Mean | 10.9% | 10.6% |
| Median | 9.9% | 10.4% |
| Interquartile 25% (IQ1) | 8.7% | 8.9% |
| Interquartile 75% (IQ3) | 11.5% | 11.7% |
| Interquartile Range (IQR) | 2.9% | 2.8% |
| Standard Deviation (Sample) | 4.3% | 3.0% |
| Standard Deviation (Population) | 4.3% | 3.0% |
Similar Demographics by Male Disability
Demographics Similar to Peruvians by Male Disability
In terms of male disability, the demographic groups most similar to Peruvians are Immigrants from Eritrea (10.4%, a difference of 0.020%), Immigrants from Uzbekistan (10.4%, a difference of 0.040%), Immigrants from Saudi Arabia (10.4%, a difference of 0.060%), Tongan (10.4%, a difference of 0.060%), and Salvadoran (10.4%, a difference of 0.080%).
| Demographics | Rating | Rank | Male Disability |
| Immigrants | Peru | 99.7 /100 | #47 | Exceptional 10.3% |
| Israelis | 99.7 /100 | #48 | Exceptional 10.3% |
| Immigrants | Spain | 99.7 /100 | #49 | Exceptional 10.3% |
| South Americans | 99.6 /100 | #50 | Exceptional 10.3% |
| Salvadorans | 99.6 /100 | #51 | Exceptional 10.4% |
| Immigrants | Saudi Arabia | 99.6 /100 | #52 | Exceptional 10.4% |
| Immigrants | Uzbekistan | 99.6 /100 | #53 | Exceptional 10.4% |
| Peruvians | 99.6 /100 | #54 | Exceptional 10.4% |
| Immigrants | Eritrea | 99.6 /100 | #55 | Exceptional 10.4% |
| Tongans | 99.6 /100 | #56 | Exceptional 10.4% |
| Immigrants | South America | 99.6 /100 | #57 | Exceptional 10.4% |
| Immigrants | Japan | 99.5 /100 | #58 | Exceptional 10.4% |
| Immigrants | Australia | 99.5 /100 | #59 | Exceptional 10.4% |
| Immigrants | Colombia | 99.5 /100 | #60 | Exceptional 10.4% |
| Immigrants | Northern Africa | 99.4 /100 | #61 | Exceptional 10.4% |
Demographics Similar to Immigrants from Sierra Leone by Male Disability
In terms of male disability, the demographic groups most similar to Immigrants from Sierra Leone are Sierra Leonean (10.5%, a difference of 0.040%), Laotian (10.6%, a difference of 0.060%), Immigrants from Russia (10.6%, a difference of 0.080%), Immigrants from Lebanon (10.5%, a difference of 0.16%), and Immigrants from Lithuania (10.5%, a difference of 0.30%).
| Demographics | Rating | Rank | Male Disability |
| Ecuadorians | 99.2 /100 | #69 | Exceptional 10.5% |
| Immigrants | Bulgaria | 99.1 /100 | #70 | Exceptional 10.5% |
| Immigrants | Cameroon | 99.0 /100 | #71 | Exceptional 10.5% |
| Immigrants | Serbia | 99.0 /100 | #72 | Exceptional 10.5% |
| Immigrants | Lithuania | 98.9 /100 | #73 | Exceptional 10.5% |
| Immigrants | Lebanon | 98.8 /100 | #74 | Exceptional 10.5% |
| Sierra Leoneans | 98.7 /100 | #75 | Exceptional 10.5% |
| Immigrants | Sierra Leone | 98.7 /100 | #76 | Exceptional 10.5% |
| Laotians | 98.6 /100 | #77 | Exceptional 10.6% |
| Immigrants | Russia | 98.6 /100 | #78 | Exceptional 10.6% |
| Zimbabweans | 98.4 /100 | #79 | Exceptional 10.6% |
| Immigrants | Jordan | 98.4 /100 | #80 | Exceptional 10.6% |
| Immigrants | Chile | 98.3 /100 | #81 | Exceptional 10.6% |
| Immigrants | Guyana | 98.2 /100 | #82 | Exceptional 10.6% |
| Immigrants | Poland | 98.1 /100 | #83 | Exceptional 10.6% |