Panamanian vs Immigrants from India Male Disability
COMPARE
Panamanian
Immigrants from India
Male Disability
Male Disability Comparison
Panamanians
Immigrants from India
11.7%
MALE DISABILITY
3.8/ 100
METRIC RATING
219th/ 347
METRIC RANK
9.0%
MALE DISABILITY
100.0/ 100
METRIC RATING
1st/ 347
METRIC RANK
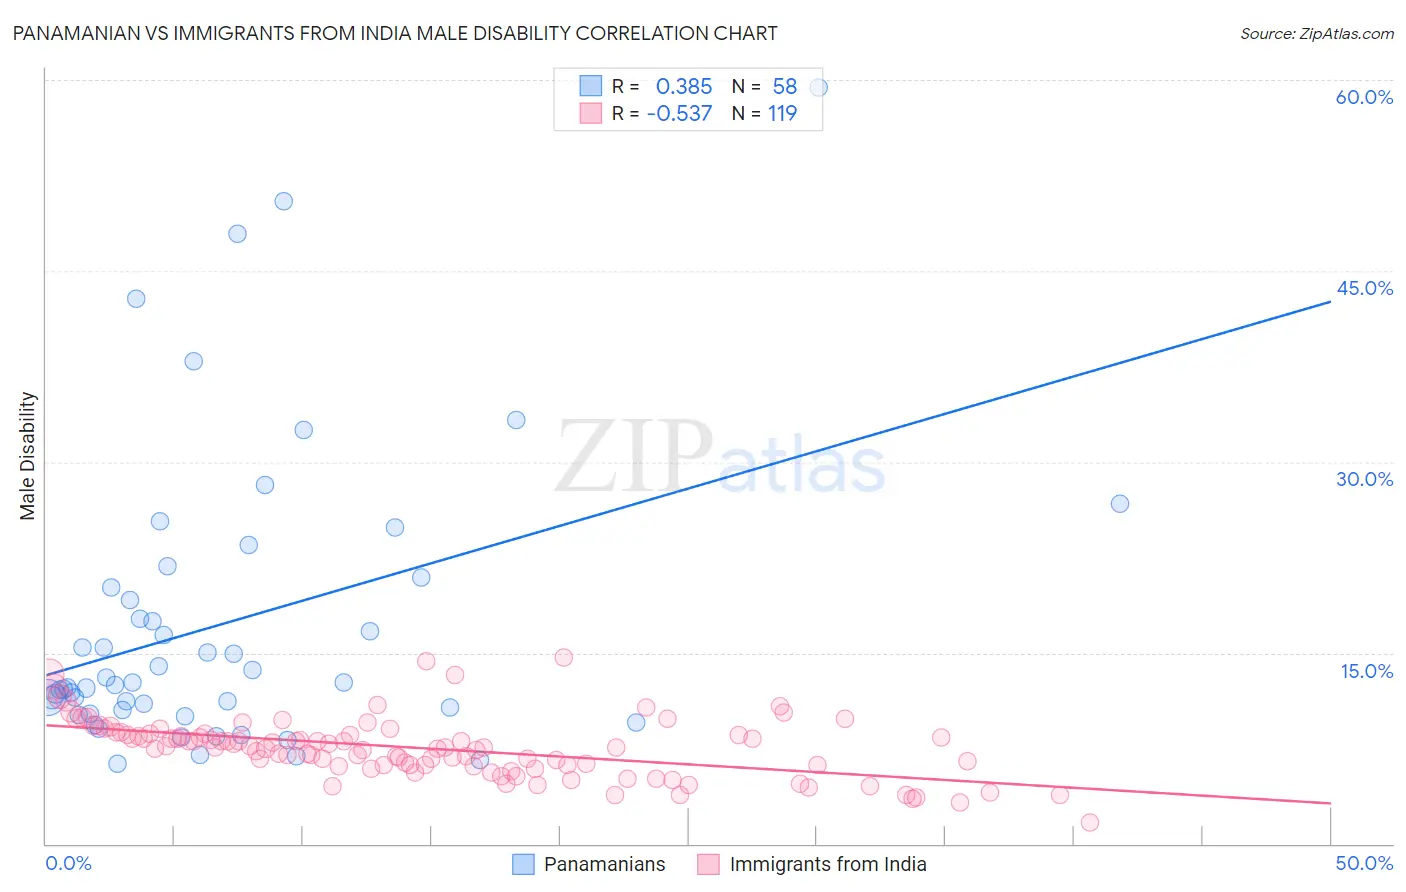
Panamanian vs Immigrants from India Male Disability Correlation Chart
The statistical analysis conducted on geographies consisting of 281,191,975 people shows a mild positive correlation between the proportion of Panamanians and percentage of males with a disability in the United States with a correlation coefficient (R) of 0.385 and weighted average of 11.7%. Similarly, the statistical analysis conducted on geographies consisting of 434,062,130 people shows a substantial negative correlation between the proportion of Immigrants from India and percentage of males with a disability in the United States with a correlation coefficient (R) of -0.537 and weighted average of 9.0%, a difference of 29.8%.
Male Disability Correlation Summary
| Measurement | Panamanian | Immigrants from India |
| Minimum | 6.3% | 1.6% |
| Maximum | 59.5% | 14.7% |
| Range | 53.2% | 13.0% |
| Mean | 17.3% | 7.5% |
| Median | 12.6% | 7.6% |
| Interquartile 25% (IQ1) | 10.5% | 6.2% |
| Interquartile 75% (IQ3) | 20.1% | 8.6% |
| Interquartile Range (IQR) | 9.6% | 2.5% |
| Standard Deviation (Sample) | 11.5% | 2.3% |
| Standard Deviation (Population) | 11.4% | 2.3% |
Similar Demographics by Male Disability
Demographics Similar to Panamanians by Male Disability
In terms of male disability, the demographic groups most similar to Panamanians are Immigrants from Western Europe (11.7%, a difference of 0.010%), Immigrants from Congo (11.7%, a difference of 0.020%), Immigrants from England (11.7%, a difference of 0.060%), Alsatian (11.7%, a difference of 0.17%), and Immigrants from Bahamas (11.7%, a difference of 0.26%).
| Demographics | Rating | Rank | Male Disability |
| Immigrants | Scotland | 8.2 /100 | #212 | Tragic 11.6% |
| Mexican American Indians | 7.8 /100 | #213 | Tragic 11.6% |
| Lithuanians | 6.6 /100 | #214 | Tragic 11.6% |
| Indonesians | 5.9 /100 | #215 | Tragic 11.6% |
| Immigrants | Dominican Republic | 4.9 /100 | #216 | Tragic 11.7% |
| Immigrants | Dominica | 4.6 /100 | #217 | Tragic 11.7% |
| Immigrants | England | 4.0 /100 | #218 | Tragic 11.7% |
| Panamanians | 3.8 /100 | #219 | Tragic 11.7% |
| Immigrants | Western Europe | 3.8 /100 | #220 | Tragic 11.7% |
| Immigrants | Congo | 3.7 /100 | #221 | Tragic 11.7% |
| Alsatians | 3.3 /100 | #222 | Tragic 11.7% |
| Immigrants | Bahamas | 3.2 /100 | #223 | Tragic 11.7% |
| Japanese | 3.1 /100 | #224 | Tragic 11.7% |
| Liberians | 3.1 /100 | #225 | Tragic 11.8% |
| Sub-Saharan Africans | 2.8 /100 | #226 | Tragic 11.8% |
Demographics Similar to Immigrants from India by Male Disability
In terms of male disability, the demographic groups most similar to Immigrants from India are Immigrants from Taiwan (9.1%, a difference of 0.89%), Filipino (9.1%, a difference of 0.90%), Thai (9.2%, a difference of 2.2%), Immigrants from Hong Kong (9.4%, a difference of 4.4%), and Immigrants from South Central Asia (9.4%, a difference of 4.4%).
| Demographics | Rating | Rank | Male Disability |
| Immigrants | India | 100.0 /100 | #1 | Exceptional 9.0% |
| Immigrants | Taiwan | 100.0 /100 | #2 | Exceptional 9.1% |
| Filipinos | 100.0 /100 | #3 | Exceptional 9.1% |
| Thais | 100.0 /100 | #4 | Exceptional 9.2% |
| Immigrants | Hong Kong | 100.0 /100 | #5 | Exceptional 9.4% |
| Immigrants | South Central Asia | 100.0 /100 | #6 | Exceptional 9.4% |
| Immigrants | Bolivia | 100.0 /100 | #7 | Exceptional 9.5% |
| Immigrants | China | 100.0 /100 | #8 | Exceptional 9.5% |
| Immigrants | Singapore | 100.0 /100 | #9 | Exceptional 9.5% |
| Immigrants | Israel | 100.0 /100 | #10 | Exceptional 9.6% |
| Immigrants | Eastern Asia | 100.0 /100 | #11 | Exceptional 9.6% |
| Bolivians | 100.0 /100 | #12 | Exceptional 9.6% |
| Iranians | 100.0 /100 | #13 | Exceptional 9.7% |
| Immigrants | Iran | 100.0 /100 | #14 | Exceptional 9.7% |
| Indians (Asian) | 100.0 /100 | #15 | Exceptional 9.7% |