Panamanian vs Immigrants from India Ambulatory Disability
COMPARE
Panamanian
Immigrants from India
Ambulatory Disability
Ambulatory Disability Comparison
Panamanians
Immigrants from India
6.4%
AMBULATORY DISABILITY
3.1/ 100
METRIC RATING
231st/ 347
METRIC RANK
4.8%
AMBULATORY DISABILITY
100.0/ 100
METRIC RATING
1st/ 347
METRIC RANK
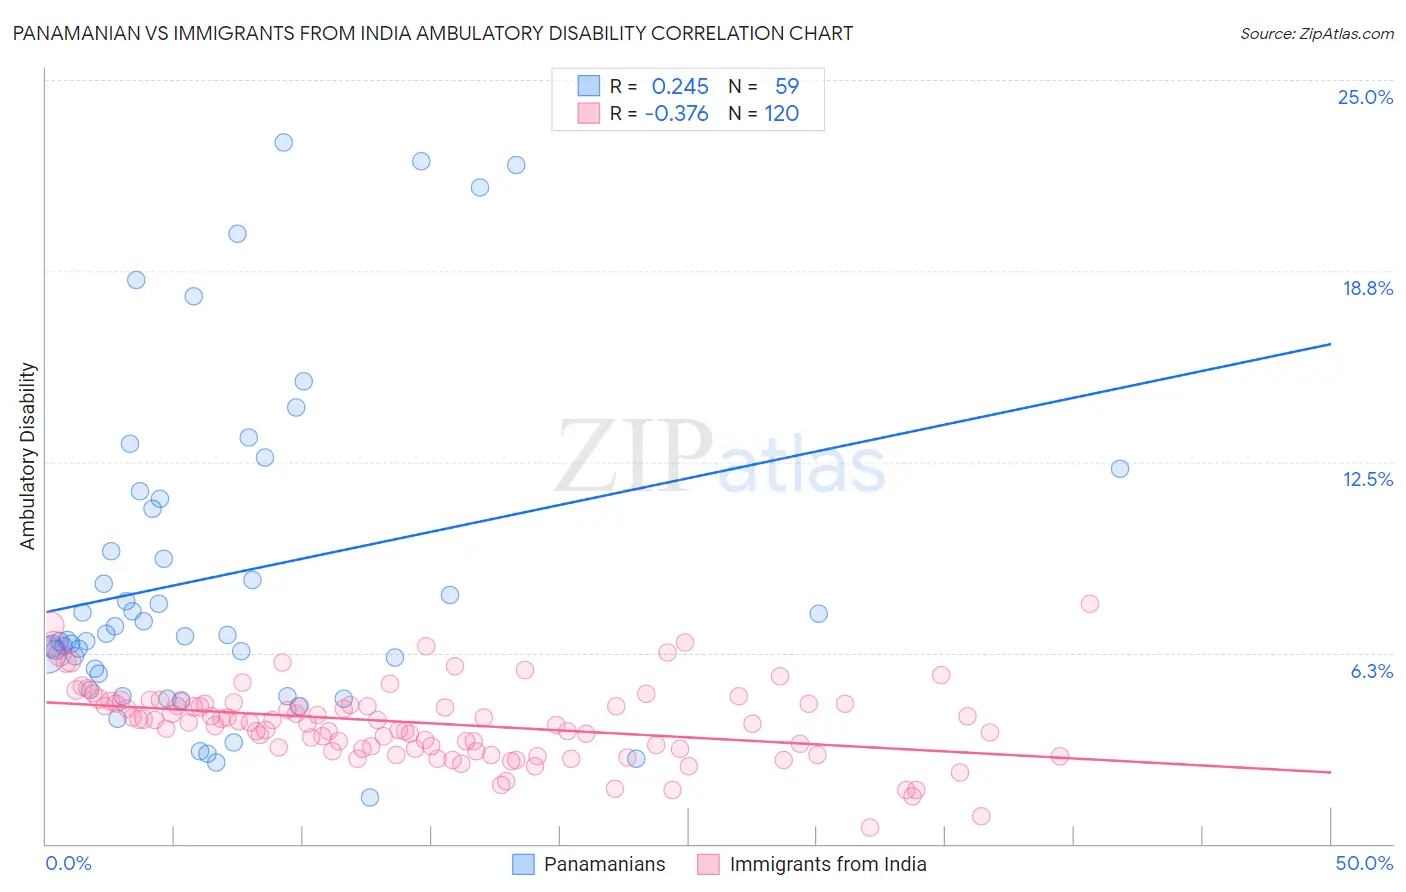
Panamanian vs Immigrants from India Ambulatory Disability Correlation Chart
The statistical analysis conducted on geographies consisting of 281,171,683 people shows a weak positive correlation between the proportion of Panamanians and percentage of population with ambulatory disability in the United States with a correlation coefficient (R) of 0.245 and weighted average of 6.4%. Similarly, the statistical analysis conducted on geographies consisting of 433,949,483 people shows a mild negative correlation between the proportion of Immigrants from India and percentage of population with ambulatory disability in the United States with a correlation coefficient (R) of -0.376 and weighted average of 4.8%, a difference of 34.1%.
Ambulatory Disability Correlation Summary
| Measurement | Panamanian | Immigrants from India |
| Minimum | 1.5% | 0.54% |
| Maximum | 23.0% | 7.8% |
| Range | 21.5% | 7.3% |
| Mean | 8.8% | 4.0% |
| Median | 6.8% | 4.0% |
| Interquartile 25% (IQ1) | 5.6% | 3.1% |
| Interquartile 75% (IQ3) | 11.3% | 4.6% |
| Interquartile Range (IQR) | 5.7% | 1.5% |
| Standard Deviation (Sample) | 5.3% | 1.3% |
| Standard Deviation (Population) | 5.3% | 1.2% |
Similar Demographics by Ambulatory Disability
Demographics Similar to Panamanians by Ambulatory Disability
In terms of ambulatory disability, the demographic groups most similar to Panamanians are Mexican (6.4%, a difference of 0.16%), Czechoslovakian (6.4%, a difference of 0.26%), Portuguese (6.4%, a difference of 0.31%), Cuban (6.4%, a difference of 0.32%), and Assyrian/Chaldean/Syriac (6.4%, a difference of 0.33%).
| Demographics | Rating | Rank | Ambulatory Disability |
| Liberians | 7.1 /100 | #224 | Tragic 6.3% |
| Hondurans | 6.3 /100 | #225 | Tragic 6.3% |
| Slavs | 5.1 /100 | #226 | Tragic 6.4% |
| Cubans | 4.0 /100 | #227 | Tragic 6.4% |
| Portuguese | 4.0 /100 | #228 | Tragic 6.4% |
| Czechoslovakians | 3.8 /100 | #229 | Tragic 6.4% |
| Mexicans | 3.5 /100 | #230 | Tragic 6.4% |
| Panamanians | 3.1 /100 | #231 | Tragic 6.4% |
| Assyrians/Chaldeans/Syriacs | 2.4 /100 | #232 | Tragic 6.4% |
| Sub-Saharan Africans | 2.3 /100 | #233 | Tragic 6.4% |
| Immigrants | Liberia | 2.3 /100 | #234 | Tragic 6.4% |
| Hispanics or Latinos | 2.2 /100 | #235 | Tragic 6.4% |
| Dutch | 2.0 /100 | #236 | Tragic 6.4% |
| Immigrants | Germany | 1.8 /100 | #237 | Tragic 6.4% |
| Haitians | 1.8 /100 | #238 | Tragic 6.4% |
Demographics Similar to Immigrants from India by Ambulatory Disability
In terms of ambulatory disability, the demographic groups most similar to Immigrants from India are Filipino (4.9%, a difference of 2.0%), Thai (4.9%, a difference of 3.2%), Immigrants from Taiwan (4.9%, a difference of 3.5%), Immigrants from Singapore (5.0%, a difference of 4.9%), and Immigrants from Bolivia (5.0%, a difference of 5.7%).
| Demographics | Rating | Rank | Ambulatory Disability |
| Immigrants | India | 100.0 /100 | #1 | Exceptional 4.8% |
| Filipinos | 100.0 /100 | #2 | Exceptional 4.9% |
| Thais | 100.0 /100 | #3 | Exceptional 4.9% |
| Immigrants | Taiwan | 100.0 /100 | #4 | Exceptional 4.9% |
| Immigrants | Singapore | 100.0 /100 | #5 | Exceptional 5.0% |
| Immigrants | Bolivia | 100.0 /100 | #6 | Exceptional 5.0% |
| Bolivians | 100.0 /100 | #7 | Exceptional 5.1% |
| Immigrants | South Central Asia | 100.0 /100 | #8 | Exceptional 5.1% |
| Iranians | 100.0 /100 | #9 | Exceptional 5.1% |
| Yup'ik | 100.0 /100 | #10 | Exceptional 5.2% |
| Immigrants | Korea | 100.0 /100 | #11 | Exceptional 5.2% |
| Okinawans | 100.0 /100 | #12 | Exceptional 5.3% |
| Burmese | 100.0 /100 | #13 | Exceptional 5.3% |
| Immigrants | Eastern Asia | 100.0 /100 | #14 | Exceptional 5.3% |
| Immigrants | China | 100.0 /100 | #15 | Exceptional 5.3% |