Norwegian vs Nonimmigrants Disability Age 65 to 74
COMPARE
Norwegian
Nonimmigrants
Disability Age 65 to 74
Disability Age 65 to 74 Comparison
Norwegians
Nonimmigrants
22.5%
DISABILITY AGE 65 TO 74
92.5/ 100
METRIC RATING
124th/ 347
METRIC RANK
25.0%
DISABILITY AGE 65 TO 74
0.7/ 100
METRIC RATING
251st/ 347
METRIC RANK
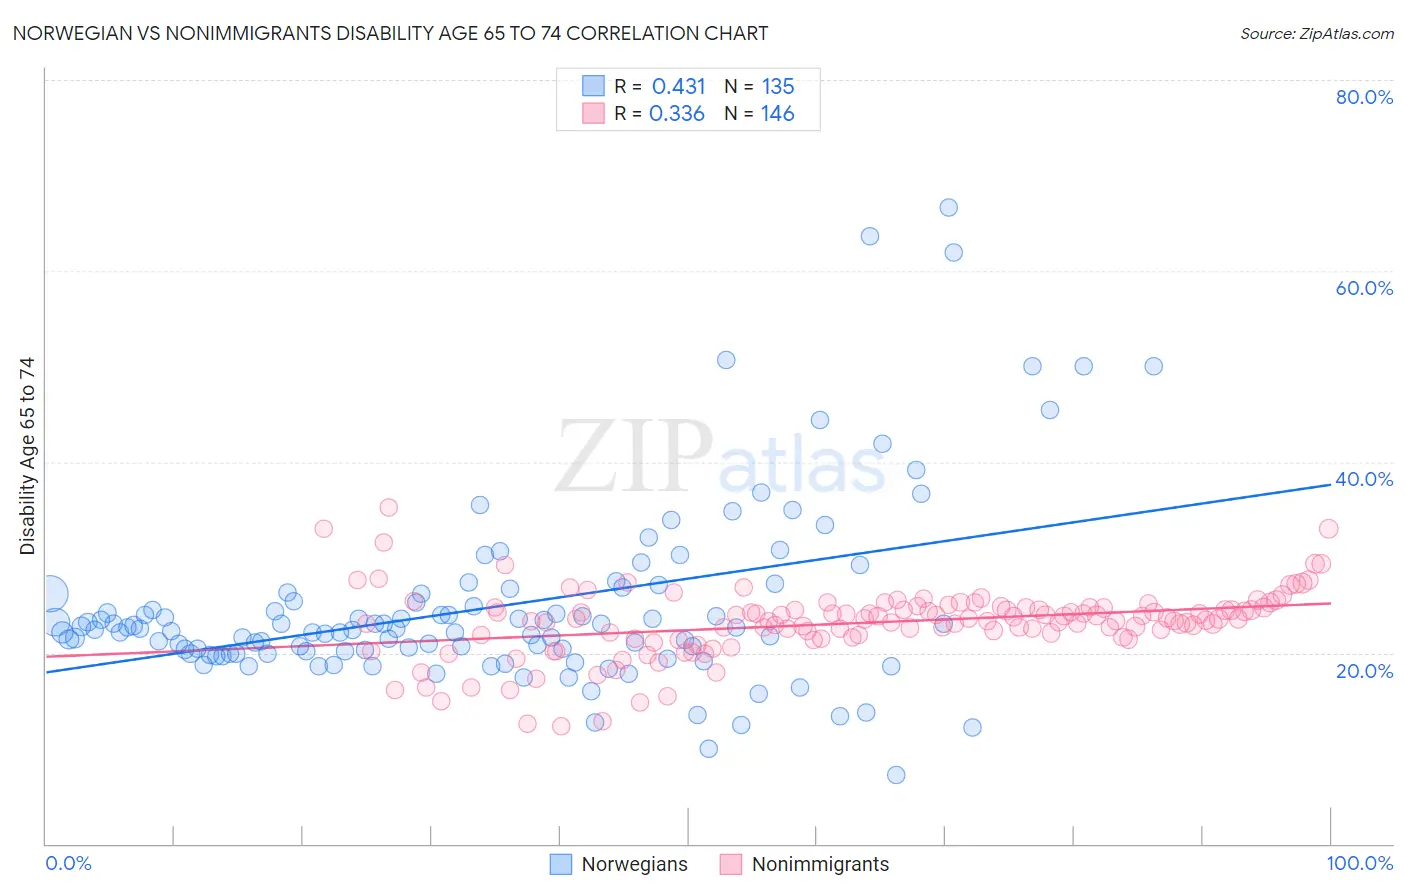
Norwegian vs Nonimmigrants Disability Age 65 to 74 Correlation Chart
The statistical analysis conducted on geographies consisting of 531,492,634 people shows a moderate positive correlation between the proportion of Norwegians and percentage of population with a disability between the ages 65 and 75 in the United States with a correlation coefficient (R) of 0.431 and weighted average of 22.5%. Similarly, the statistical analysis conducted on geographies consisting of 581,657,399 people shows a mild positive correlation between the proportion of Nonimmigrants and percentage of population with a disability between the ages 65 and 75 in the United States with a correlation coefficient (R) of 0.336 and weighted average of 25.0%, a difference of 11.3%.
Disability Age 65 to 74 Correlation Summary
| Measurement | Norwegian | Nonimmigrants |
| Minimum | 7.1% | 12.3% |
| Maximum | 66.7% | 35.2% |
| Range | 59.5% | 22.8% |
| Mean | 24.8% | 23.1% |
| Median | 22.4% | 23.5% |
| Interquartile 25% (IQ1) | 19.9% | 21.7% |
| Interquartile 75% (IQ3) | 26.1% | 24.8% |
| Interquartile Range (IQR) | 6.2% | 3.1% |
| Standard Deviation (Sample) | 9.6% | 3.6% |
| Standard Deviation (Population) | 9.6% | 3.6% |
Similar Demographics by Disability Age 65 to 74
Demographics Similar to Norwegians by Disability Age 65 to 74
In terms of disability age 65 to 74, the demographic groups most similar to Norwegians are Immigrants from Western Europe (22.5%, a difference of 0.040%), Lebanese (22.5%, a difference of 0.060%), Slovak (22.5%, a difference of 0.17%), Hungarian (22.4%, a difference of 0.19%), and Czech (22.4%, a difference of 0.24%).
| Demographics | Rating | Rank | Disability Age 65 to 74 |
| Swedes | 94.7 /100 | #117 | Exceptional 22.4% |
| Austrians | 94.7 /100 | #118 | Exceptional 22.4% |
| Immigrants | Northern Africa | 94.7 /100 | #119 | Exceptional 22.4% |
| Immigrants | Kazakhstan | 93.9 /100 | #120 | Exceptional 22.4% |
| Czechs | 93.5 /100 | #121 | Exceptional 22.4% |
| Immigrants | Jordan | 93.5 /100 | #122 | Exceptional 22.4% |
| Hungarians | 93.3 /100 | #123 | Exceptional 22.4% |
| Norwegians | 92.5 /100 | #124 | Exceptional 22.5% |
| Immigrants | Western Europe | 92.3 /100 | #125 | Exceptional 22.5% |
| Lebanese | 92.2 /100 | #126 | Exceptional 22.5% |
| Slovaks | 91.6 /100 | #127 | Exceptional 22.5% |
| Immigrants | Costa Rica | 90.4 /100 | #128 | Exceptional 22.6% |
| Immigrants | Uruguay | 90.1 /100 | #129 | Exceptional 22.6% |
| Immigrants | Albania | 90.0 /100 | #130 | Excellent 22.6% |
| Immigrants | Nepal | 89.4 /100 | #131 | Excellent 22.6% |
Demographics Similar to Nonimmigrants by Disability Age 65 to 74
In terms of disability age 65 to 74, the demographic groups most similar to Nonimmigrants are Immigrants from El Salvador (25.1%, a difference of 0.19%), Salvadoran (25.0%, a difference of 0.20%), Immigrants from Fiji (25.0%, a difference of 0.22%), Subsaharan African (25.1%, a difference of 0.23%), and Somali (25.1%, a difference of 0.30%).
| Demographics | Rating | Rank | Disability Age 65 to 74 |
| Armenians | 2.0 /100 | #244 | Tragic 24.7% |
| British West Indians | 2.0 /100 | #245 | Tragic 24.7% |
| Immigrants | Iraq | 1.9 /100 | #246 | Tragic 24.7% |
| Indonesians | 1.1 /100 | #247 | Tragic 24.9% |
| Senegalese | 0.9 /100 | #248 | Tragic 24.9% |
| Immigrants | Fiji | 0.8 /100 | #249 | Tragic 25.0% |
| Salvadorans | 0.8 /100 | #250 | Tragic 25.0% |
| Immigrants | Nonimmigrants | 0.7 /100 | #251 | Tragic 25.0% |
| Immigrants | El Salvador | 0.6 /100 | #252 | Tragic 25.1% |
| Sub-Saharan Africans | 0.6 /100 | #253 | Tragic 25.1% |
| Somalis | 0.6 /100 | #254 | Tragic 25.1% |
| Central Americans | 0.5 /100 | #255 | Tragic 25.1% |
| Immigrants | Somalia | 0.4 /100 | #256 | Tragic 25.2% |
| Guamanians/Chamorros | 0.3 /100 | #257 | Tragic 25.3% |
| Marshallese | 0.3 /100 | #258 | Tragic 25.3% |