Norwegian vs Nepalese Disability Age 65 to 74
COMPARE
Norwegian
Nepalese
Disability Age 65 to 74
Disability Age 65 to 74 Comparison
Norwegians
Nepalese
22.5%
DISABILITY AGE 65 TO 74
92.5/ 100
METRIC RATING
124th/ 347
METRIC RANK
28.0%
DISABILITY AGE 65 TO 74
0.0/ 100
METRIC RATING
318th/ 347
METRIC RANK
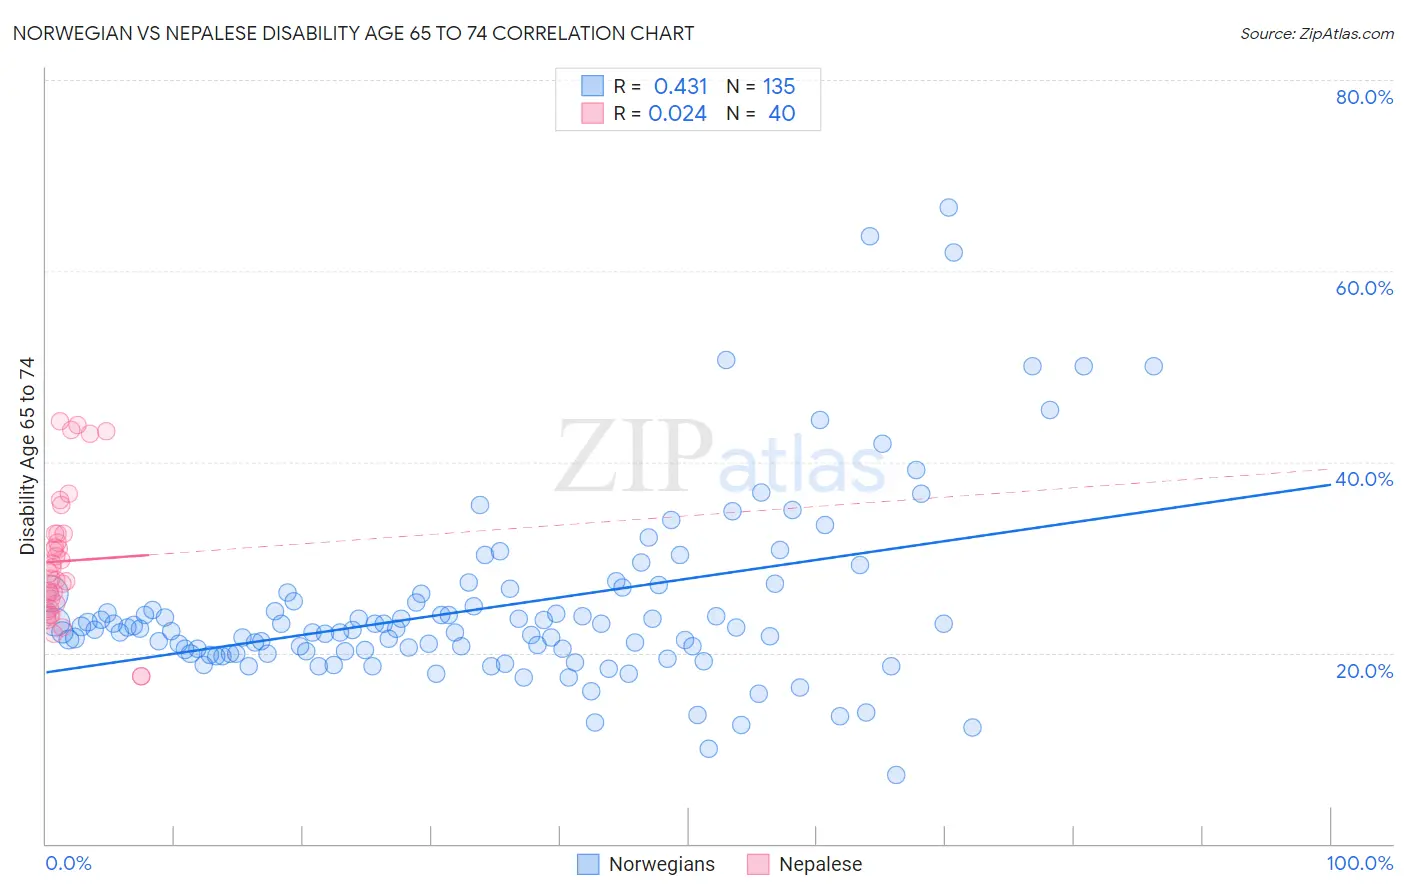
Norwegian vs Nepalese Disability Age 65 to 74 Correlation Chart
The statistical analysis conducted on geographies consisting of 531,492,634 people shows a moderate positive correlation between the proportion of Norwegians and percentage of population with a disability between the ages 65 and 75 in the United States with a correlation coefficient (R) of 0.431 and weighted average of 22.5%. Similarly, the statistical analysis conducted on geographies consisting of 24,503,622 people shows no correlation between the proportion of Nepalese and percentage of population with a disability between the ages 65 and 75 in the United States with a correlation coefficient (R) of 0.024 and weighted average of 28.0%, a difference of 24.6%.
Disability Age 65 to 74 Correlation Summary
| Measurement | Norwegian | Nepalese |
| Minimum | 7.1% | 17.6% |
| Maximum | 66.7% | 44.3% |
| Range | 59.5% | 26.7% |
| Mean | 24.8% | 29.6% |
| Median | 22.4% | 28.1% |
| Interquartile 25% (IQ1) | 19.9% | 24.9% |
| Interquartile 75% (IQ3) | 26.1% | 32.4% |
| Interquartile Range (IQR) | 6.2% | 7.5% |
| Standard Deviation (Sample) | 9.6% | 6.8% |
| Standard Deviation (Population) | 9.6% | 6.7% |
Similar Demographics by Disability Age 65 to 74
Demographics Similar to Norwegians by Disability Age 65 to 74
In terms of disability age 65 to 74, the demographic groups most similar to Norwegians are Immigrants from Western Europe (22.5%, a difference of 0.040%), Lebanese (22.5%, a difference of 0.060%), Slovak (22.5%, a difference of 0.17%), Hungarian (22.4%, a difference of 0.19%), and Czech (22.4%, a difference of 0.24%).
| Demographics | Rating | Rank | Disability Age 65 to 74 |
| Swedes | 94.7 /100 | #117 | Exceptional 22.4% |
| Austrians | 94.7 /100 | #118 | Exceptional 22.4% |
| Immigrants | Northern Africa | 94.7 /100 | #119 | Exceptional 22.4% |
| Immigrants | Kazakhstan | 93.9 /100 | #120 | Exceptional 22.4% |
| Czechs | 93.5 /100 | #121 | Exceptional 22.4% |
| Immigrants | Jordan | 93.5 /100 | #122 | Exceptional 22.4% |
| Hungarians | 93.3 /100 | #123 | Exceptional 22.4% |
| Norwegians | 92.5 /100 | #124 | Exceptional 22.5% |
| Immigrants | Western Europe | 92.3 /100 | #125 | Exceptional 22.5% |
| Lebanese | 92.2 /100 | #126 | Exceptional 22.5% |
| Slovaks | 91.6 /100 | #127 | Exceptional 22.5% |
| Immigrants | Costa Rica | 90.4 /100 | #128 | Exceptional 22.6% |
| Immigrants | Uruguay | 90.1 /100 | #129 | Exceptional 22.6% |
| Immigrants | Albania | 90.0 /100 | #130 | Excellent 22.6% |
| Immigrants | Nepal | 89.4 /100 | #131 | Excellent 22.6% |
Demographics Similar to Nepalese by Disability Age 65 to 74
In terms of disability age 65 to 74, the demographic groups most similar to Nepalese are Immigrants from Armenia (28.0%, a difference of 0.22%), Arapaho (28.1%, a difference of 0.23%), Crow (27.9%, a difference of 0.31%), Cajun (27.9%, a difference of 0.35%), and Cherokee (28.2%, a difference of 0.62%).
| Demographics | Rating | Rank | Disability Age 65 to 74 |
| Menominee | 0.0 /100 | #311 | Tragic 27.4% |
| Osage | 0.0 /100 | #312 | Tragic 27.5% |
| Paiute | 0.0 /100 | #313 | Tragic 27.8% |
| Chippewa | 0.0 /100 | #314 | Tragic 27.8% |
| Cajuns | 0.0 /100 | #315 | Tragic 27.9% |
| Crow | 0.0 /100 | #316 | Tragic 27.9% |
| Immigrants | Armenia | 0.0 /100 | #317 | Tragic 28.0% |
| Nepalese | 0.0 /100 | #318 | Tragic 28.0% |
| Arapaho | 0.0 /100 | #319 | Tragic 28.1% |
| Cherokee | 0.0 /100 | #320 | Tragic 28.2% |
| Comanche | 0.0 /100 | #321 | Tragic 28.3% |
| Aleuts | 0.0 /100 | #322 | Tragic 28.4% |
| Puerto Ricans | 0.0 /100 | #323 | Tragic 29.1% |
| Seminole | 0.0 /100 | #324 | Tragic 29.4% |
| Dutch West Indians | 0.0 /100 | #325 | Tragic 29.6% |