Norwegian vs Immigrants from Greece Disability Age 65 to 74
COMPARE
Norwegian
Immigrants from Greece
Disability Age 65 to 74
Disability Age 65 to 74 Comparison
Norwegians
Immigrants from Greece
22.5%
DISABILITY AGE 65 TO 74
92.5/ 100
METRIC RATING
124th/ 347
METRIC RANK
21.0%
DISABILITY AGE 65 TO 74
99.9/ 100
METRIC RATING
30th/ 347
METRIC RANK
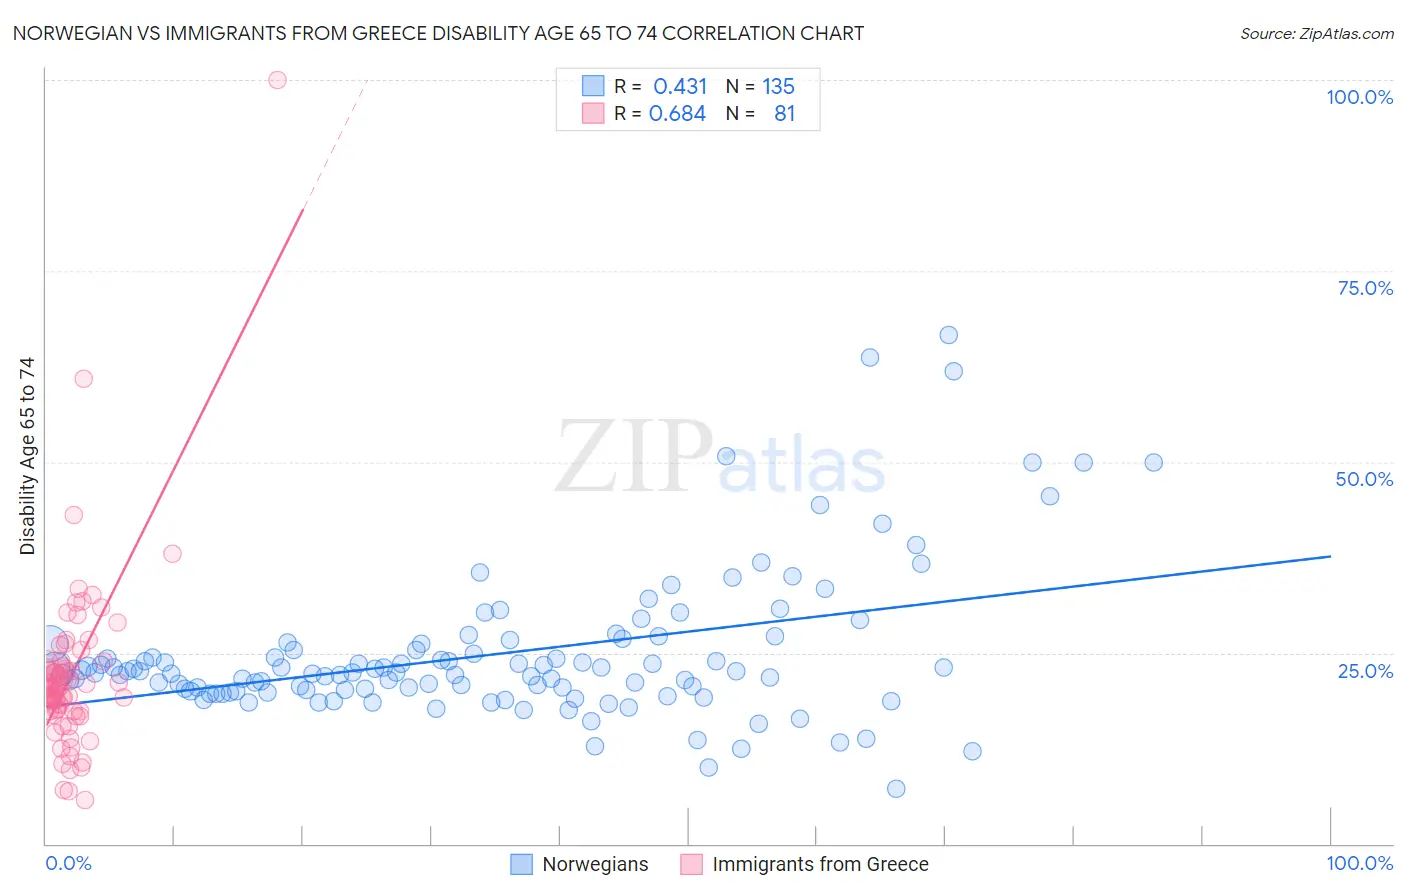
Norwegian vs Immigrants from Greece Disability Age 65 to 74 Correlation Chart
The statistical analysis conducted on geographies consisting of 531,492,634 people shows a moderate positive correlation between the proportion of Norwegians and percentage of population with a disability between the ages 65 and 75 in the United States with a correlation coefficient (R) of 0.431 and weighted average of 22.5%. Similarly, the statistical analysis conducted on geographies consisting of 216,768,071 people shows a significant positive correlation between the proportion of Immigrants from Greece and percentage of population with a disability between the ages 65 and 75 in the United States with a correlation coefficient (R) of 0.684 and weighted average of 21.0%, a difference of 7.0%.
Disability Age 65 to 74 Correlation Summary
| Measurement | Norwegian | Immigrants from Greece |
| Minimum | 7.1% | 5.8% |
| Maximum | 66.7% | 100.0% |
| Range | 59.5% | 94.2% |
| Mean | 24.8% | 22.0% |
| Median | 22.4% | 20.5% |
| Interquartile 25% (IQ1) | 19.9% | 17.4% |
| Interquartile 75% (IQ3) | 26.1% | 23.4% |
| Interquartile Range (IQR) | 6.2% | 6.0% |
| Standard Deviation (Sample) | 9.6% | 11.9% |
| Standard Deviation (Population) | 9.6% | 11.8% |
Similar Demographics by Disability Age 65 to 74
Demographics Similar to Norwegians by Disability Age 65 to 74
In terms of disability age 65 to 74, the demographic groups most similar to Norwegians are Immigrants from Western Europe (22.5%, a difference of 0.040%), Lebanese (22.5%, a difference of 0.060%), Slovak (22.5%, a difference of 0.17%), Hungarian (22.4%, a difference of 0.19%), and Czech (22.4%, a difference of 0.24%).
| Demographics | Rating | Rank | Disability Age 65 to 74 |
| Swedes | 94.7 /100 | #117 | Exceptional 22.4% |
| Austrians | 94.7 /100 | #118 | Exceptional 22.4% |
| Immigrants | Northern Africa | 94.7 /100 | #119 | Exceptional 22.4% |
| Immigrants | Kazakhstan | 93.9 /100 | #120 | Exceptional 22.4% |
| Czechs | 93.5 /100 | #121 | Exceptional 22.4% |
| Immigrants | Jordan | 93.5 /100 | #122 | Exceptional 22.4% |
| Hungarians | 93.3 /100 | #123 | Exceptional 22.4% |
| Norwegians | 92.5 /100 | #124 | Exceptional 22.5% |
| Immigrants | Western Europe | 92.3 /100 | #125 | Exceptional 22.5% |
| Lebanese | 92.2 /100 | #126 | Exceptional 22.5% |
| Slovaks | 91.6 /100 | #127 | Exceptional 22.5% |
| Immigrants | Costa Rica | 90.4 /100 | #128 | Exceptional 22.6% |
| Immigrants | Uruguay | 90.1 /100 | #129 | Exceptional 22.6% |
| Immigrants | Albania | 90.0 /100 | #130 | Excellent 22.6% |
| Immigrants | Nepal | 89.4 /100 | #131 | Excellent 22.6% |
Demographics Similar to Immigrants from Greece by Disability Age 65 to 74
In terms of disability age 65 to 74, the demographic groups most similar to Immigrants from Greece are Immigrants from Japan (21.0%, a difference of 0.040%), Immigrants from Northern Europe (21.0%, a difference of 0.040%), Turkish (21.0%, a difference of 0.070%), Immigrants from Czechoslovakia (21.0%, a difference of 0.080%), and Immigrants from Sweden (21.0%, a difference of 0.18%).
| Demographics | Rating | Rank | Disability Age 65 to 74 |
| Immigrants | Belgium | 99.9 /100 | #23 | Exceptional 21.0% |
| Soviet Union | 99.9 /100 | #24 | Exceptional 21.0% |
| Bolivians | 99.9 /100 | #25 | Exceptional 21.0% |
| Immigrants | Australia | 99.9 /100 | #26 | Exceptional 21.0% |
| Immigrants | Sweden | 99.9 /100 | #27 | Exceptional 21.0% |
| Immigrants | Czechoslovakia | 99.9 /100 | #28 | Exceptional 21.0% |
| Immigrants | Japan | 99.9 /100 | #29 | Exceptional 21.0% |
| Immigrants | Greece | 99.9 /100 | #30 | Exceptional 21.0% |
| Immigrants | Northern Europe | 99.9 /100 | #31 | Exceptional 21.0% |
| Turks | 99.9 /100 | #32 | Exceptional 21.0% |
| Immigrants | Argentina | 99.9 /100 | #33 | Exceptional 21.1% |
| Immigrants | Sri Lanka | 99.9 /100 | #34 | Exceptional 21.1% |
| Bulgarians | 99.9 /100 | #35 | Exceptional 21.1% |
| Immigrants | Switzerland | 99.8 /100 | #36 | Exceptional 21.1% |
| Israelis | 99.8 /100 | #37 | Exceptional 21.2% |