Native/Alaskan vs Immigrants from Spain Disability Age Over 75
COMPARE
Native/Alaskan
Immigrants from Spain
Disability Age Over 75
Disability Age Over 75 Comparison
Natives/Alaskans
Immigrants from Spain
53.1%
DISABILITY AGE OVER 75
0.0/ 100
METRIC RATING
332nd/ 347
METRIC RANK
46.0%
DISABILITY AGE OVER 75
99.4/ 100
METRIC RATING
67th/ 347
METRIC RANK
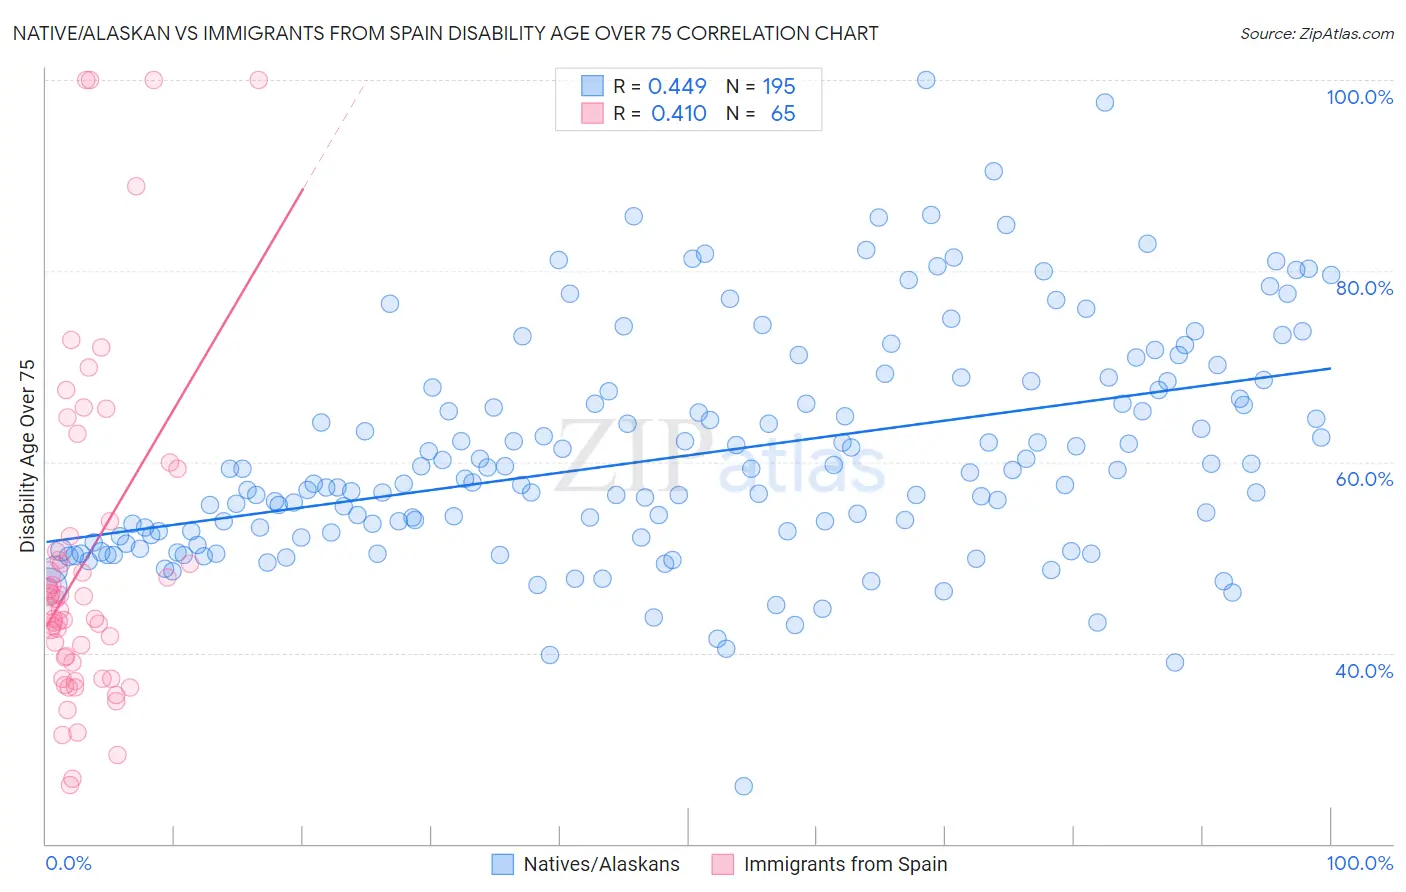
Native/Alaskan vs Immigrants from Spain Disability Age Over 75 Correlation Chart
The statistical analysis conducted on geographies consisting of 511,593,286 people shows a moderate positive correlation between the proportion of Natives/Alaskans and percentage of population with a disability over the age of 75 in the United States with a correlation coefficient (R) of 0.449 and weighted average of 53.1%. Similarly, the statistical analysis conducted on geographies consisting of 239,494,309 people shows a moderate positive correlation between the proportion of Immigrants from Spain and percentage of population with a disability over the age of 75 in the United States with a correlation coefficient (R) of 0.410 and weighted average of 46.0%, a difference of 15.4%.
Disability Age Over 75 Correlation Summary
| Measurement | Native/Alaskan | Immigrants from Spain |
| Minimum | 26.0% | 26.2% |
| Maximum | 100.0% | 100.0% |
| Range | 74.0% | 73.8% |
| Mean | 60.6% | 49.7% |
| Median | 57.9% | 44.9% |
| Interquartile 25% (IQ1) | 52.1% | 38.2% |
| Interquartile 75% (IQ3) | 67.5% | 53.0% |
| Interquartile Range (IQR) | 15.4% | 14.9% |
| Standard Deviation (Sample) | 11.8% | 17.6% |
| Standard Deviation (Population) | 11.8% | 17.4% |
Similar Demographics by Disability Age Over 75
Demographics Similar to Natives/Alaskans by Disability Age Over 75
In terms of disability age over 75, the demographic groups most similar to Natives/Alaskans are Hopi (52.9%, a difference of 0.29%), Puerto Rican (52.9%, a difference of 0.31%), Alaska Native (52.8%, a difference of 0.49%), Choctaw (52.7%, a difference of 0.70%), and Nepalese (52.6%, a difference of 0.89%).
| Demographics | Rating | Rank | Disability Age Over 75 |
| Immigrants | Cabo Verde | 0.0 /100 | #325 | Tragic 52.4% |
| Ute | 0.0 /100 | #326 | Tragic 52.6% |
| Nepalese | 0.0 /100 | #327 | Tragic 52.6% |
| Choctaw | 0.0 /100 | #328 | Tragic 52.7% |
| Alaska Natives | 0.0 /100 | #329 | Tragic 52.8% |
| Puerto Ricans | 0.0 /100 | #330 | Tragic 52.9% |
| Hopi | 0.0 /100 | #331 | Tragic 52.9% |
| Natives/Alaskans | 0.0 /100 | #332 | Tragic 53.1% |
| Apache | 0.0 /100 | #333 | Tragic 53.6% |
| Alaskan Athabascans | 0.0 /100 | #334 | Tragic 54.0% |
| Kiowa | 0.0 /100 | #335 | Tragic 54.2% |
| Immigrants | Armenia | 0.0 /100 | #336 | Tragic 54.3% |
| Yuman | 0.0 /100 | #337 | Tragic 54.4% |
| Colville | 0.0 /100 | #338 | Tragic 55.4% |
| Pima | 0.0 /100 | #339 | Tragic 55.8% |
Demographics Similar to Immigrants from Spain by Disability Age Over 75
In terms of disability age over 75, the demographic groups most similar to Immigrants from Spain are Immigrants from England (46.0%, a difference of 0.030%), Austrian (46.0%, a difference of 0.040%), Immigrants from South Central Asia (46.0%, a difference of 0.040%), Immigrants from North Macedonia (45.9%, a difference of 0.070%), and Immigrants from Norway (45.9%, a difference of 0.080%).
| Demographics | Rating | Rank | Disability Age Over 75 |
| Immigrants | Europe | 99.6 /100 | #60 | Exceptional 45.9% |
| Immigrants | Argentina | 99.6 /100 | #61 | Exceptional 45.9% |
| Burmese | 99.5 /100 | #62 | Exceptional 45.9% |
| Immigrants | Norway | 99.5 /100 | #63 | Exceptional 45.9% |
| Immigrants | North Macedonia | 99.5 /100 | #64 | Exceptional 45.9% |
| Austrians | 99.5 /100 | #65 | Exceptional 46.0% |
| Immigrants | England | 99.5 /100 | #66 | Exceptional 46.0% |
| Immigrants | Spain | 99.4 /100 | #67 | Exceptional 46.0% |
| Immigrants | South Central Asia | 99.4 /100 | #68 | Exceptional 46.0% |
| Immigrants | Romania | 99.3 /100 | #69 | Exceptional 46.0% |
| Jordanians | 99.2 /100 | #70 | Exceptional 46.1% |
| Immigrants | Sri Lanka | 99.2 /100 | #71 | Exceptional 46.1% |
| Immigrants | Hungary | 99.1 /100 | #72 | Exceptional 46.1% |
| Cambodians | 99.1 /100 | #73 | Exceptional 46.1% |
| Egyptians | 99.0 /100 | #74 | Exceptional 46.1% |