Native/Alaskan vs Immigrants from Mexico Disability Age Over 75
COMPARE
Native/Alaskan
Immigrants from Mexico
Disability Age Over 75
Disability Age Over 75 Comparison
Natives/Alaskans
Immigrants from Mexico
53.1%
DISABILITY AGE OVER 75
0.0/ 100
METRIC RATING
332nd/ 347
METRIC RANK
51.1%
DISABILITY AGE OVER 75
0.0/ 100
METRIC RATING
314th/ 347
METRIC RANK
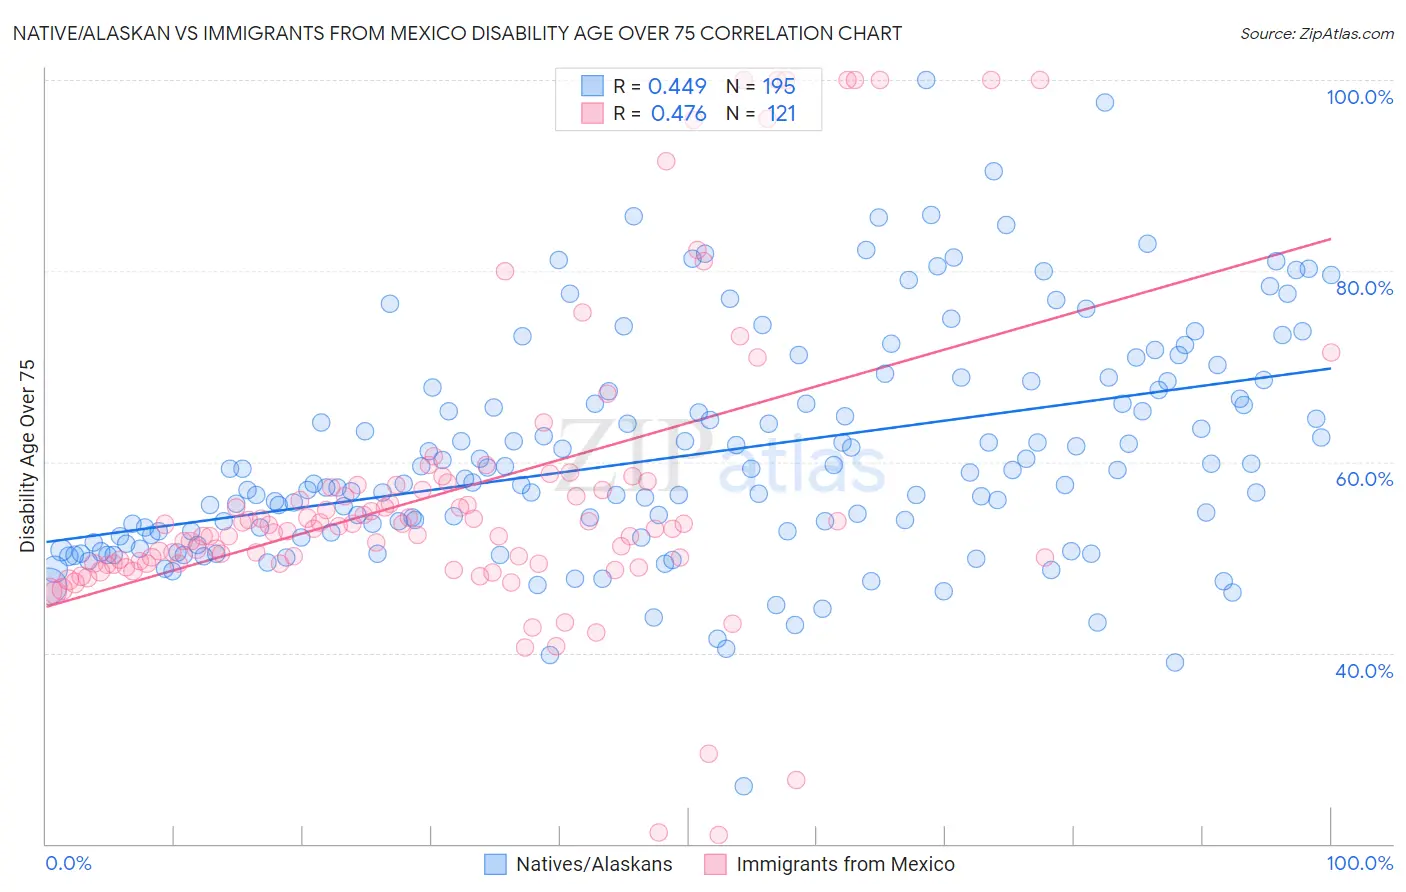
Native/Alaskan vs Immigrants from Mexico Disability Age Over 75 Correlation Chart
The statistical analysis conducted on geographies consisting of 511,593,286 people shows a moderate positive correlation between the proportion of Natives/Alaskans and percentage of population with a disability over the age of 75 in the United States with a correlation coefficient (R) of 0.449 and weighted average of 53.1%. Similarly, the statistical analysis conducted on geographies consisting of 512,333,705 people shows a moderate positive correlation between the proportion of Immigrants from Mexico and percentage of population with a disability over the age of 75 in the United States with a correlation coefficient (R) of 0.476 and weighted average of 51.1%, a difference of 3.8%.
Disability Age Over 75 Correlation Summary
| Measurement | Native/Alaskan | Immigrants from Mexico |
| Minimum | 26.0% | 20.9% |
| Maximum | 100.0% | 100.0% |
| Range | 74.0% | 79.1% |
| Mean | 60.6% | 56.9% |
| Median | 57.9% | 53.0% |
| Interquartile 25% (IQ1) | 52.1% | 49.3% |
| Interquartile 75% (IQ3) | 67.5% | 57.6% |
| Interquartile Range (IQR) | 15.4% | 8.2% |
| Standard Deviation (Sample) | 11.8% | 15.9% |
| Standard Deviation (Population) | 11.8% | 15.9% |
Demographics Similar to Natives/Alaskans and Immigrants from Mexico by Disability Age Over 75
In terms of disability age over 75, the demographic groups most similar to Natives/Alaskans are Hopi (52.9%, a difference of 0.29%), Puerto Rican (52.9%, a difference of 0.31%), Alaska Native (52.8%, a difference of 0.49%), Choctaw (52.7%, a difference of 0.70%), and Nepalese (52.6%, a difference of 0.89%). Similarly, the demographic groups most similar to Immigrants from Mexico are Mexican (51.1%, a difference of 0.050%), Chickasaw (51.2%, a difference of 0.19%), Immigrants from the Azores (50.9%, a difference of 0.37%), Yakama (51.3%, a difference of 0.37%), and Seminole (51.5%, a difference of 0.70%).
| Demographics | Rating | Rank | Disability Age Over 75 |
| Immigrants | Azores | 0.0 /100 | #313 | Tragic 50.9% |
| Immigrants | Mexico | 0.0 /100 | #314 | Tragic 51.1% |
| Mexicans | 0.0 /100 | #315 | Tragic 51.1% |
| Chickasaw | 0.0 /100 | #316 | Tragic 51.2% |
| Yakama | 0.0 /100 | #317 | Tragic 51.3% |
| Seminole | 0.0 /100 | #318 | Tragic 51.5% |
| Creek | 0.0 /100 | #319 | Tragic 51.5% |
| Paiute | 0.0 /100 | #320 | Tragic 51.5% |
| Dutch West Indians | 0.0 /100 | #321 | Tragic 51.5% |
| Comanche | 0.0 /100 | #322 | Tragic 51.7% |
| Immigrants | Yemen | 0.0 /100 | #323 | Tragic 52.0% |
| Menominee | 0.0 /100 | #324 | Tragic 52.3% |
| Immigrants | Cabo Verde | 0.0 /100 | #325 | Tragic 52.4% |
| Ute | 0.0 /100 | #326 | Tragic 52.6% |
| Nepalese | 0.0 /100 | #327 | Tragic 52.6% |
| Choctaw | 0.0 /100 | #328 | Tragic 52.7% |
| Alaska Natives | 0.0 /100 | #329 | Tragic 52.8% |
| Puerto Ricans | 0.0 /100 | #330 | Tragic 52.9% |
| Hopi | 0.0 /100 | #331 | Tragic 52.9% |
| Natives/Alaskans | 0.0 /100 | #332 | Tragic 53.1% |
| Apache | 0.0 /100 | #333 | Tragic 53.6% |