Native/Alaskan vs Ethiopian Disability Age Over 75
COMPARE
Native/Alaskan
Ethiopian
Disability Age Over 75
Disability Age Over 75 Comparison
Natives/Alaskans
Ethiopians
53.1%
DISABILITY AGE OVER 75
0.0/ 100
METRIC RATING
332nd/ 347
METRIC RANK
46.8%
DISABILITY AGE OVER 75
88.9/ 100
METRIC RATING
135th/ 347
METRIC RANK
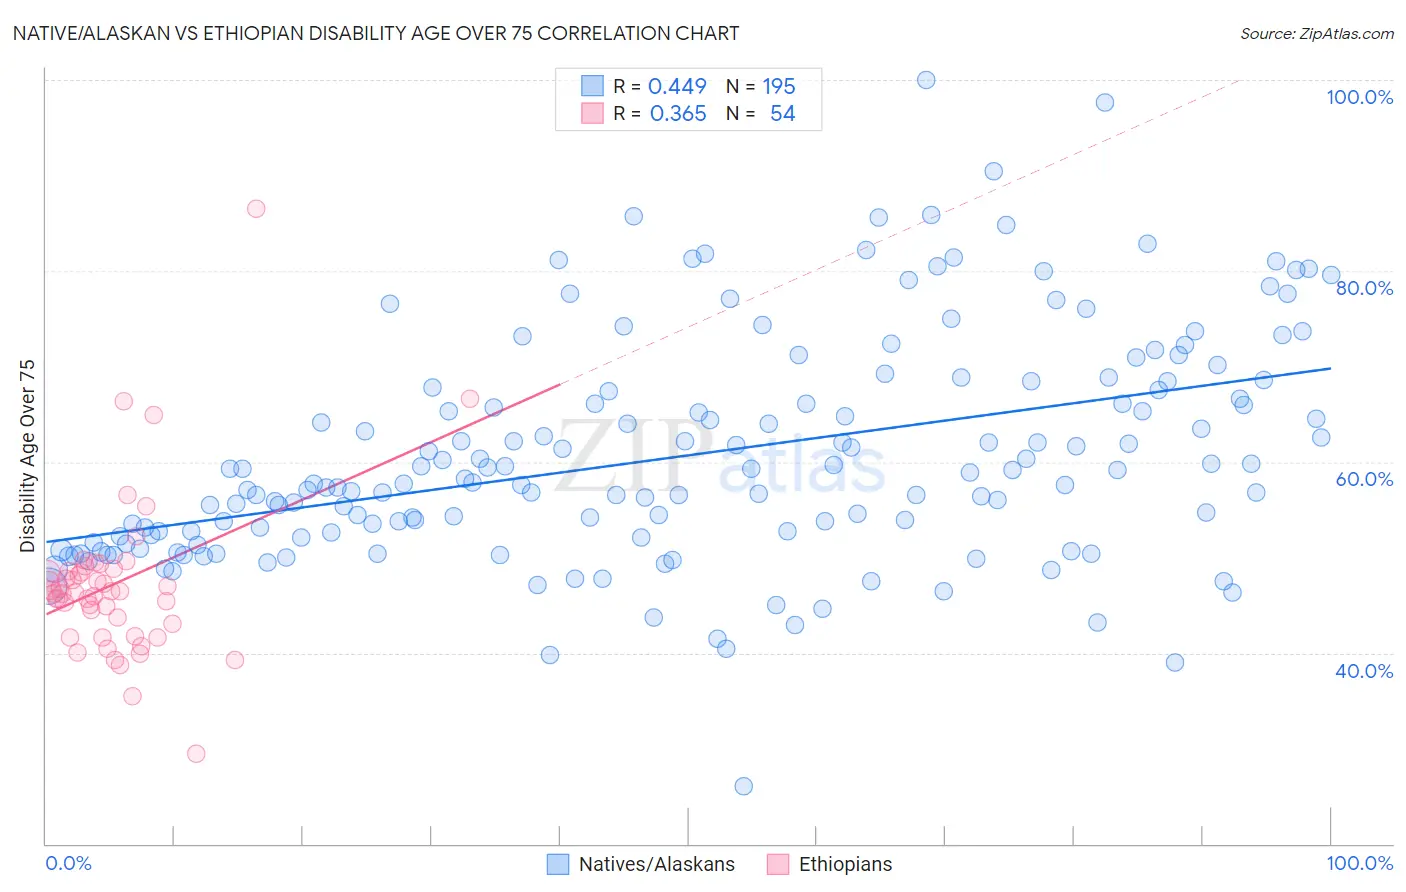
Native/Alaskan vs Ethiopian Disability Age Over 75 Correlation Chart
The statistical analysis conducted on geographies consisting of 511,593,286 people shows a moderate positive correlation between the proportion of Natives/Alaskans and percentage of population with a disability over the age of 75 in the United States with a correlation coefficient (R) of 0.449 and weighted average of 53.1%. Similarly, the statistical analysis conducted on geographies consisting of 222,925,097 people shows a mild positive correlation between the proportion of Ethiopians and percentage of population with a disability over the age of 75 in the United States with a correlation coefficient (R) of 0.365 and weighted average of 46.8%, a difference of 13.4%.
Disability Age Over 75 Correlation Summary
| Measurement | Native/Alaskan | Ethiopian |
| Minimum | 26.0% | 29.5% |
| Maximum | 100.0% | 86.5% |
| Range | 74.0% | 57.0% |
| Mean | 60.6% | 47.3% |
| Median | 57.9% | 46.4% |
| Interquartile 25% (IQ1) | 52.1% | 43.0% |
| Interquartile 75% (IQ3) | 67.5% | 48.6% |
| Interquartile Range (IQR) | 15.4% | 5.5% |
| Standard Deviation (Sample) | 11.8% | 8.5% |
| Standard Deviation (Population) | 11.8% | 8.4% |
Similar Demographics by Disability Age Over 75
Demographics Similar to Natives/Alaskans by Disability Age Over 75
In terms of disability age over 75, the demographic groups most similar to Natives/Alaskans are Hopi (52.9%, a difference of 0.29%), Puerto Rican (52.9%, a difference of 0.31%), Alaska Native (52.8%, a difference of 0.49%), Choctaw (52.7%, a difference of 0.70%), and Nepalese (52.6%, a difference of 0.89%).
| Demographics | Rating | Rank | Disability Age Over 75 |
| Immigrants | Cabo Verde | 0.0 /100 | #325 | Tragic 52.4% |
| Ute | 0.0 /100 | #326 | Tragic 52.6% |
| Nepalese | 0.0 /100 | #327 | Tragic 52.6% |
| Choctaw | 0.0 /100 | #328 | Tragic 52.7% |
| Alaska Natives | 0.0 /100 | #329 | Tragic 52.8% |
| Puerto Ricans | 0.0 /100 | #330 | Tragic 52.9% |
| Hopi | 0.0 /100 | #331 | Tragic 52.9% |
| Natives/Alaskans | 0.0 /100 | #332 | Tragic 53.1% |
| Apache | 0.0 /100 | #333 | Tragic 53.6% |
| Alaskan Athabascans | 0.0 /100 | #334 | Tragic 54.0% |
| Kiowa | 0.0 /100 | #335 | Tragic 54.2% |
| Immigrants | Armenia | 0.0 /100 | #336 | Tragic 54.3% |
| Yuman | 0.0 /100 | #337 | Tragic 54.4% |
| Colville | 0.0 /100 | #338 | Tragic 55.4% |
| Pima | 0.0 /100 | #339 | Tragic 55.8% |
Demographics Similar to Ethiopians by Disability Age Over 75
In terms of disability age over 75, the demographic groups most similar to Ethiopians are Immigrants from Ethiopia (46.8%, a difference of 0.010%), Immigrants from Venezuela (46.8%, a difference of 0.010%), Immigrants from Uganda (46.8%, a difference of 0.020%), Immigrants from Bosnia and Herzegovina (46.8%, a difference of 0.020%), and Yugoslavian (46.8%, a difference of 0.020%).
| Demographics | Rating | Rank | Disability Age Over 75 |
| Icelanders | 90.9 /100 | #128 | Exceptional 46.7% |
| Immigrants | Germany | 90.8 /100 | #129 | Exceptional 46.7% |
| Immigrants | Northern Africa | 90.7 /100 | #130 | Exceptional 46.7% |
| Scottish | 90.5 /100 | #131 | Exceptional 46.7% |
| South Americans | 90.0 /100 | #132 | Excellent 46.8% |
| English | 89.4 /100 | #133 | Excellent 46.8% |
| Immigrants | Ethiopia | 89.1 /100 | #134 | Excellent 46.8% |
| Ethiopians | 88.9 /100 | #135 | Excellent 46.8% |
| Immigrants | Venezuela | 88.6 /100 | #136 | Excellent 46.8% |
| Immigrants | Uganda | 88.5 /100 | #137 | Excellent 46.8% |
| Immigrants | Bosnia and Herzegovina | 88.5 /100 | #138 | Excellent 46.8% |
| Yugoslavians | 88.5 /100 | #139 | Excellent 46.8% |
| Immigrants | Costa Rica | 87.4 /100 | #140 | Excellent 46.8% |
| Lebanese | 87.0 /100 | #141 | Excellent 46.8% |
| Peruvians | 86.5 /100 | #142 | Excellent 46.8% |