Malaysian vs Immigrants from Nepal Female Disability
COMPARE
Malaysian
Immigrants from Nepal
Female Disability
Female Disability Comparison
Malaysians
Immigrants from Nepal
12.5%
FEMALE DISABILITY
5.0/ 100
METRIC RATING
235th/ 347
METRIC RANK
11.3%
FEMALE DISABILITY
100.0/ 100
METRIC RATING
46th/ 347
METRIC RANK
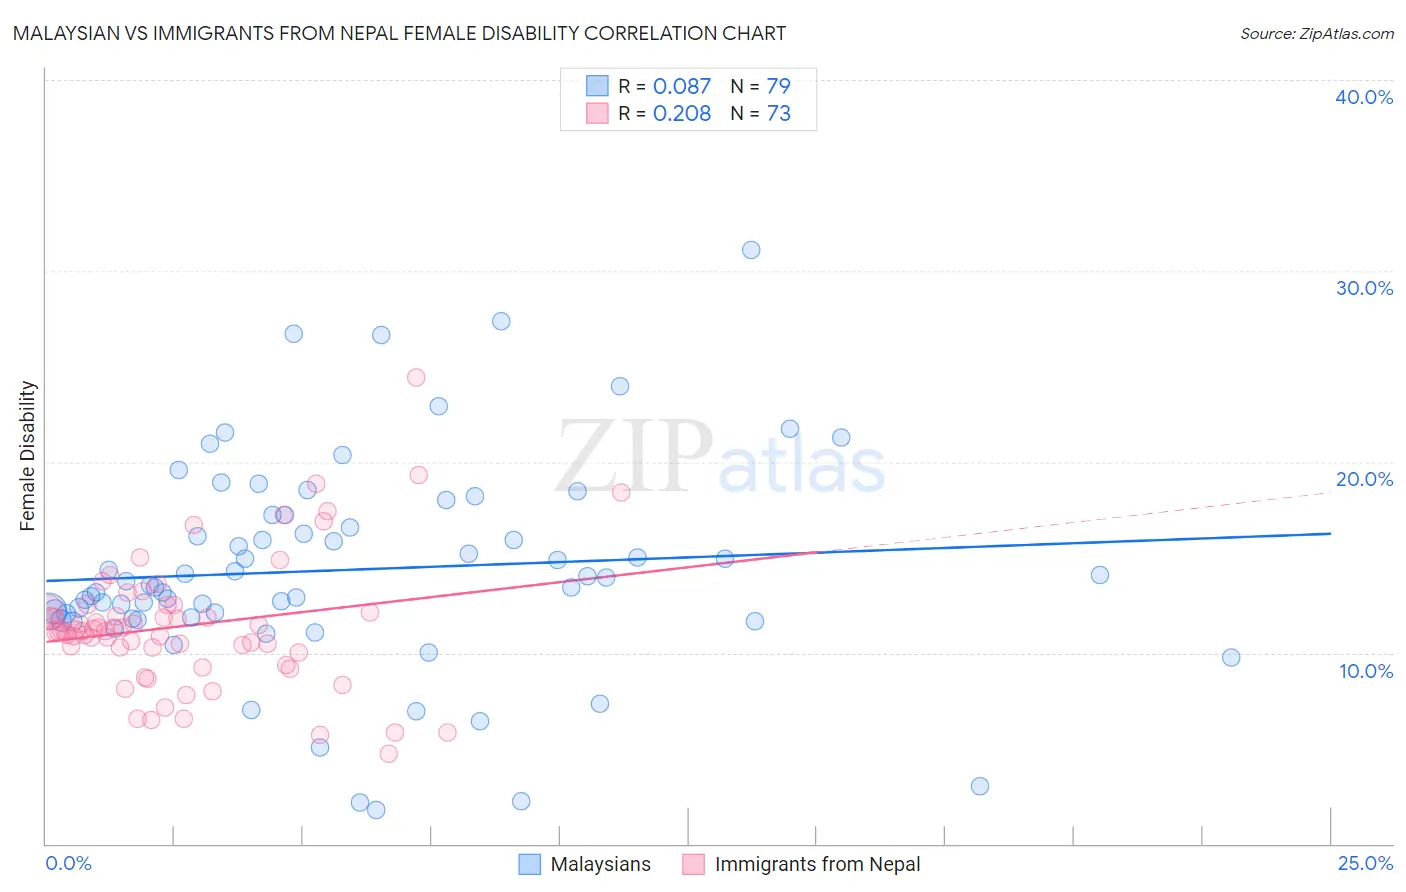
Malaysian vs Immigrants from Nepal Female Disability Correlation Chart
The statistical analysis conducted on geographies consisting of 226,065,175 people shows a slight positive correlation between the proportion of Malaysians and percentage of females with a disability in the United States with a correlation coefficient (R) of 0.087 and weighted average of 12.5%. Similarly, the statistical analysis conducted on geographies consisting of 186,780,675 people shows a weak positive correlation between the proportion of Immigrants from Nepal and percentage of females with a disability in the United States with a correlation coefficient (R) of 0.208 and weighted average of 11.3%, a difference of 11.2%.
Female Disability Correlation Summary
| Measurement | Malaysian | Immigrants from Nepal |
| Minimum | 1.8% | 4.7% |
| Maximum | 31.1% | 24.4% |
| Range | 29.3% | 19.7% |
| Mean | 14.3% | 11.4% |
| Median | 13.5% | 11.1% |
| Interquartile 25% (IQ1) | 11.8% | 10.1% |
| Interquartile 75% (IQ3) | 17.2% | 12.4% |
| Interquartile Range (IQR) | 5.4% | 2.2% |
| Standard Deviation (Sample) | 5.5% | 3.4% |
| Standard Deviation (Population) | 5.5% | 3.4% |
Similar Demographics by Female Disability
Demographics Similar to Malaysians by Female Disability
In terms of female disability, the demographic groups most similar to Malaysians are Scandinavian (12.5%, a difference of 0.050%), Immigrants from Iraq (12.5%, a difference of 0.060%), Immigrants from West Indies (12.6%, a difference of 0.13%), Immigrants from Somalia (12.5%, a difference of 0.17%), and Belgian (12.5%, a difference of 0.25%).
| Demographics | Rating | Rank | Female Disability |
| Immigrants | Cambodia | 7.8 /100 | #228 | Tragic 12.5% |
| Hungarians | 7.2 /100 | #229 | Tragic 12.5% |
| Immigrants | Belize | 7.0 /100 | #230 | Tragic 12.5% |
| Belgians | 6.5 /100 | #231 | Tragic 12.5% |
| Immigrants | Somalia | 5.9 /100 | #232 | Tragic 12.5% |
| Immigrants | Iraq | 5.3 /100 | #233 | Tragic 12.5% |
| Scandinavians | 5.3 /100 | #234 | Tragic 12.5% |
| Malaysians | 5.0 /100 | #235 | Tragic 12.5% |
| Immigrants | West Indies | 4.4 /100 | #236 | Tragic 12.6% |
| Slavs | 3.8 /100 | #237 | Tragic 12.6% |
| Yugoslavians | 3.7 /100 | #238 | Tragic 12.6% |
| Barbadians | 3.6 /100 | #239 | Tragic 12.6% |
| German Russians | 3.2 /100 | #240 | Tragic 12.6% |
| Japanese | 2.7 /100 | #241 | Tragic 12.6% |
| Canadians | 2.6 /100 | #242 | Tragic 12.6% |
Demographics Similar to Immigrants from Nepal by Female Disability
In terms of female disability, the demographic groups most similar to Immigrants from Nepal are Jordanian (11.3%, a difference of 0.020%), Zimbabwean (11.3%, a difference of 0.020%), Tongan (11.3%, a difference of 0.030%), Immigrants from Sweden (11.3%, a difference of 0.050%), and Cambodian (11.3%, a difference of 0.080%).
| Demographics | Rating | Rank | Female Disability |
| Immigrants | Lithuania | 100.0 /100 | #39 | Exceptional 11.2% |
| Mongolians | 100.0 /100 | #40 | Exceptional 11.2% |
| Paraguayans | 100.0 /100 | #41 | Exceptional 11.2% |
| Israelis | 100.0 /100 | #42 | Exceptional 11.2% |
| Afghans | 100.0 /100 | #43 | Exceptional 11.2% |
| Cambodians | 100.0 /100 | #44 | Exceptional 11.3% |
| Immigrants | Sweden | 100.0 /100 | #45 | Exceptional 11.3% |
| Immigrants | Nepal | 100.0 /100 | #46 | Exceptional 11.3% |
| Jordanians | 100.0 /100 | #47 | Exceptional 11.3% |
| Zimbabweans | 100.0 /100 | #48 | Exceptional 11.3% |
| Tongans | 100.0 /100 | #49 | Exceptional 11.3% |
| Inupiat | 100.0 /100 | #50 | Exceptional 11.3% |
| Immigrants | Belgium | 100.0 /100 | #51 | Exceptional 11.3% |
| Immigrants | Peru | 99.9 /100 | #52 | Exceptional 11.3% |
| Immigrants | Saudi Arabia | 99.9 /100 | #53 | Exceptional 11.3% |