Malaysian vs Immigrants from Nepal Unemployment Among Ages 16 to 19 years
COMPARE
Malaysian
Immigrants from Nepal
Unemployment Among Ages 16 to 19 years
Unemployment Among Ages 16 to 19 years Comparison
Malaysians
Immigrants from Nepal
17.0%
UNEMPLOYMENT AMONG AGES 16 TO 19 YEARS
94.2/ 100
METRIC RATING
108th/ 347
METRIC RANK
16.3%
UNEMPLOYMENT AMONG AGES 16 TO 19 YEARS
99.8/ 100
METRIC RATING
41st/ 347
METRIC RANK
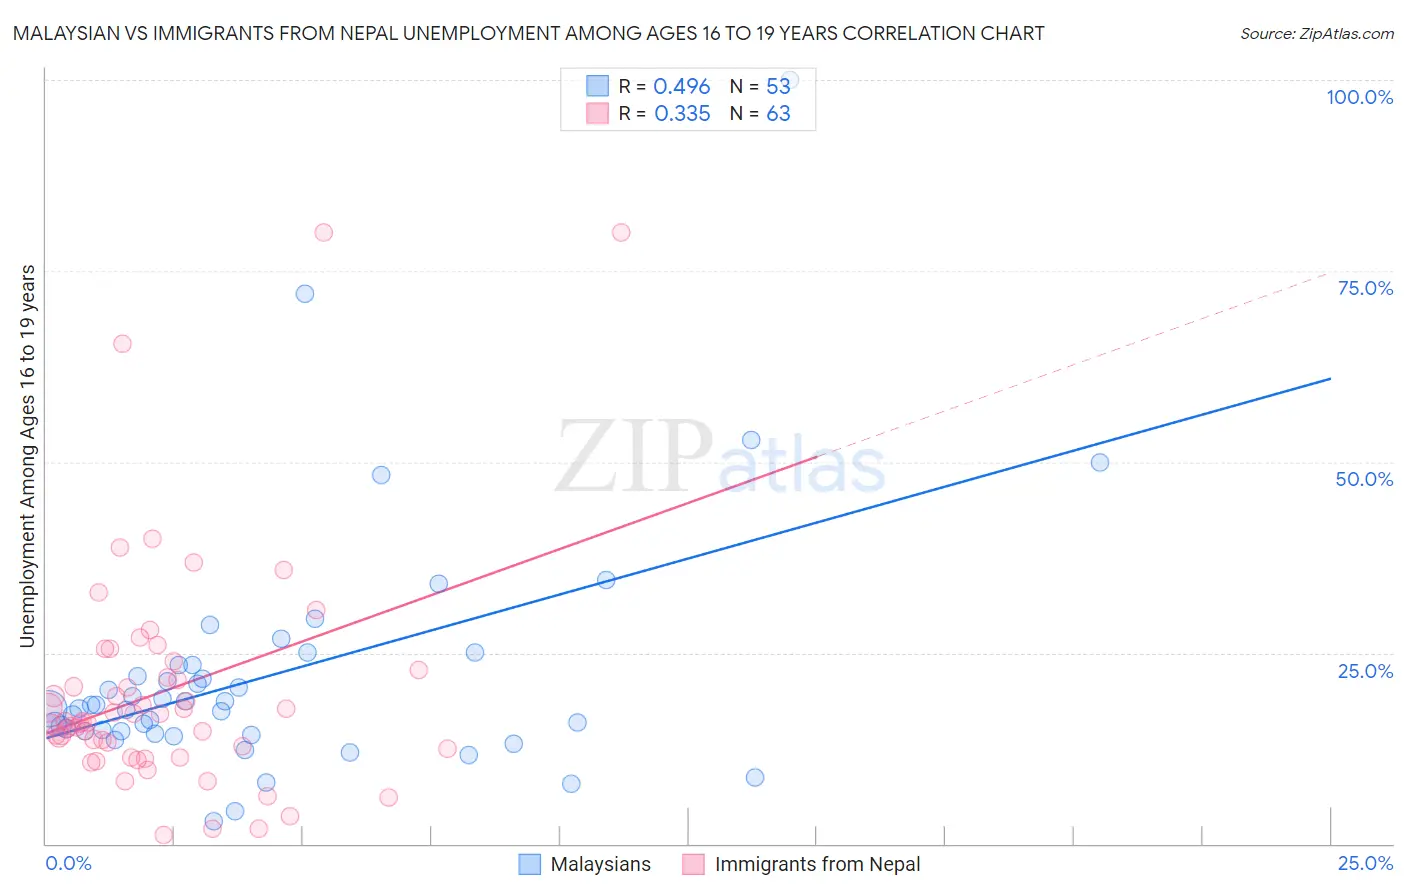
Malaysian vs Immigrants from Nepal Unemployment Among Ages 16 to 19 years Correlation Chart
The statistical analysis conducted on geographies consisting of 220,414,743 people shows a moderate positive correlation between the proportion of Malaysians and unemployment rate among population between the ages 16 and 19 in the United States with a correlation coefficient (R) of 0.496 and weighted average of 17.0%. Similarly, the statistical analysis conducted on geographies consisting of 182,920,576 people shows a mild positive correlation between the proportion of Immigrants from Nepal and unemployment rate among population between the ages 16 and 19 in the United States with a correlation coefficient (R) of 0.335 and weighted average of 16.3%, a difference of 4.2%.
Unemployment Among Ages 16 to 19 years Correlation Summary
| Measurement | Malaysian | Immigrants from Nepal |
| Minimum | 2.9% | 1.2% |
| Maximum | 100.0% | 80.0% |
| Range | 97.1% | 78.8% |
| Mean | 22.2% | 20.0% |
| Median | 17.7% | 16.0% |
| Interquartile 25% (IQ1) | 14.6% | 12.5% |
| Interquartile 75% (IQ3) | 23.4% | 22.8% |
| Interquartile Range (IQR) | 8.8% | 10.3% |
| Standard Deviation (Sample) | 16.4% | 15.1% |
| Standard Deviation (Population) | 16.2% | 15.0% |
Similar Demographics by Unemployment Among Ages 16 to 19 years
Demographics Similar to Malaysians by Unemployment Among Ages 16 to 19 years
In terms of unemployment among ages 16 to 19 years, the demographic groups most similar to Malaysians are Immigrants from Brazil (17.0%, a difference of 0.0%), Iranian (17.0%, a difference of 0.020%), Immigrants from Bulgaria (17.0%, a difference of 0.030%), Estonian (17.0%, a difference of 0.030%), and Immigrants from Netherlands (17.0%, a difference of 0.050%).
| Demographics | Rating | Rank | Unemployment Among Ages 16 to 19 years |
| Immigrants | Saudi Arabia | 94.7 /100 | #101 | Exceptional 17.0% |
| Immigrants | Pakistan | 94.6 /100 | #102 | Exceptional 17.0% |
| Palestinians | 94.6 /100 | #103 | Exceptional 17.0% |
| Italians | 94.5 /100 | #104 | Exceptional 17.0% |
| Immigrants | Bulgaria | 94.3 /100 | #105 | Exceptional 17.0% |
| Estonians | 94.3 /100 | #106 | Exceptional 17.0% |
| Immigrants | Brazil | 94.2 /100 | #107 | Exceptional 17.0% |
| Malaysians | 94.2 /100 | #108 | Exceptional 17.0% |
| Iranians | 94.1 /100 | #109 | Exceptional 17.0% |
| Immigrants | Netherlands | 93.9 /100 | #110 | Exceptional 17.0% |
| Immigrants | Asia | 93.9 /100 | #111 | Exceptional 17.0% |
| Immigrants | Iraq | 93.7 /100 | #112 | Exceptional 17.0% |
| Icelanders | 93.4 /100 | #113 | Exceptional 17.0% |
| Immigrants | Poland | 93.1 /100 | #114 | Exceptional 17.0% |
| Brazilians | 92.3 /100 | #115 | Exceptional 17.1% |
Demographics Similar to Immigrants from Nepal by Unemployment Among Ages 16 to 19 years
In terms of unemployment among ages 16 to 19 years, the demographic groups most similar to Immigrants from Nepal are Fijian (16.3%, a difference of 0.030%), Hmong (16.3%, a difference of 0.10%), Immigrants from Lebanon (16.3%, a difference of 0.10%), Croatian (16.3%, a difference of 0.21%), and Immigrants from Zimbabwe (16.3%, a difference of 0.23%).
| Demographics | Rating | Rank | Unemployment Among Ages 16 to 19 years |
| Pennsylvania Germans | 99.9 /100 | #34 | Exceptional 16.2% |
| Scottish | 99.8 /100 | #35 | Exceptional 16.2% |
| Immigrants | South Central Asia | 99.8 /100 | #36 | Exceptional 16.2% |
| Immigrants | Congo | 99.8 /100 | #37 | Exceptional 16.3% |
| Bulgarians | 99.8 /100 | #38 | Exceptional 16.3% |
| Croatians | 99.8 /100 | #39 | Exceptional 16.3% |
| Hmong | 99.8 /100 | #40 | Exceptional 16.3% |
| Immigrants | Nepal | 99.8 /100 | #41 | Exceptional 16.3% |
| Fijians | 99.8 /100 | #42 | Exceptional 16.3% |
| Immigrants | Lebanon | 99.8 /100 | #43 | Exceptional 16.3% |
| Immigrants | Zimbabwe | 99.7 /100 | #44 | Exceptional 16.3% |
| Poles | 99.7 /100 | #45 | Exceptional 16.4% |
| Immigrants | North Macedonia | 99.7 /100 | #46 | Exceptional 16.4% |
| Immigrants | Vietnam | 99.7 /100 | #47 | Exceptional 16.4% |
| Maltese | 99.7 /100 | #48 | Exceptional 16.4% |