Lebanese vs Canadian Vision Disability
COMPARE
Lebanese
Canadian
Vision Disability
Vision Disability Comparison
Lebanese
Canadians
2.2%
VISION DISABILITY
54.3/ 100
METRIC RATING
171st/ 347
METRIC RANK
2.2%
VISION DISABILITY
25.8/ 100
METRIC RATING
191st/ 347
METRIC RANK
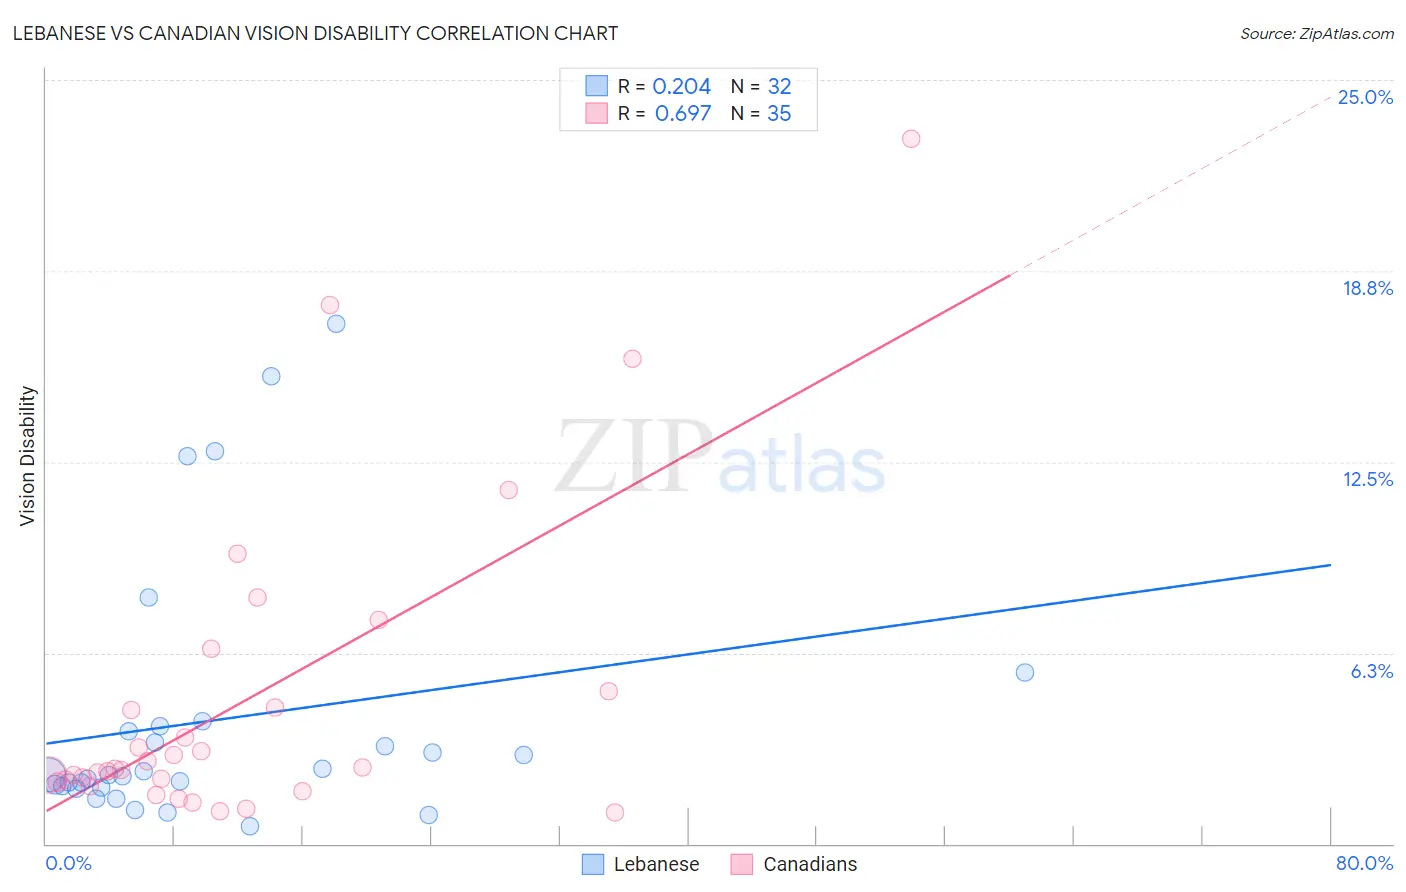
Lebanese vs Canadian Vision Disability Correlation Chart
The statistical analysis conducted on geographies consisting of 401,298,237 people shows a weak positive correlation between the proportion of Lebanese and percentage of population with vision disability in the United States with a correlation coefficient (R) of 0.204 and weighted average of 2.2%. Similarly, the statistical analysis conducted on geographies consisting of 437,069,200 people shows a significant positive correlation between the proportion of Canadians and percentage of population with vision disability in the United States with a correlation coefficient (R) of 0.697 and weighted average of 2.2%, a difference of 1.9%.
Vision Disability Correlation Summary
| Measurement | Lebanese | Canadian |
| Minimum | 0.58% | 1.0% |
| Maximum | 17.0% | 23.1% |
| Range | 16.4% | 22.0% |
| Mean | 4.0% | 4.7% |
| Median | 2.3% | 2.4% |
| Interquartile 25% (IQ1) | 1.9% | 2.0% |
| Interquartile 75% (IQ3) | 3.8% | 5.0% |
| Interquartile Range (IQR) | 1.9% | 3.0% |
| Standard Deviation (Sample) | 4.3% | 5.1% |
| Standard Deviation (Population) | 4.2% | 5.0% |
Demographics Similar to Lebanese and Canadians by Vision Disability
In terms of vision disability, the demographic groups most similar to Lebanese are Northern European (2.2%, a difference of 0.26%), Scandinavian (2.2%, a difference of 0.27%), Immigrants from Canada (2.2%, a difference of 0.27%), Immigrants from Fiji (2.2%, a difference of 0.42%), and Yugoslavian (2.2%, a difference of 0.49%). Similarly, the demographic groups most similar to Canadians are Immigrants from Costa Rica (2.2%, a difference of 0.020%), Salvadoran (2.2%, a difference of 0.13%), Guyanese (2.2%, a difference of 0.24%), Immigrants from St. Vincent and the Grenadines (2.2%, a difference of 0.34%), and Native Hawaiian (2.2%, a difference of 0.56%).
| Demographics | Rating | Rank | Vision Disability |
| Lebanese | 54.3 /100 | #171 | Average 2.2% |
| Northern Europeans | 50.1 /100 | #172 | Average 2.2% |
| Scandinavians | 50.0 /100 | #173 | Average 2.2% |
| Immigrants | Canada | 50.0 /100 | #174 | Average 2.2% |
| Immigrants | Fiji | 47.6 /100 | #175 | Average 2.2% |
| Yugoslavians | 46.5 /100 | #176 | Average 2.2% |
| Slavs | 46.0 /100 | #177 | Average 2.2% |
| Immigrants | Oceania | 45.1 /100 | #178 | Average 2.2% |
| Immigrants | North America | 44.5 /100 | #179 | Average 2.2% |
| Uruguayans | 42.7 /100 | #180 | Average 2.2% |
| Immigrants | Western Europe | 41.1 /100 | #181 | Average 2.2% |
| Costa Ricans | 40.7 /100 | #182 | Average 2.2% |
| Immigrants | Burma/Myanmar | 37.9 /100 | #183 | Fair 2.2% |
| Moroccans | 35.4 /100 | #184 | Fair 2.2% |
| Immigrants | Middle Africa | 33.5 /100 | #185 | Fair 2.2% |
| Native Hawaiians | 33.3 /100 | #186 | Fair 2.2% |
| Immigrants | St. Vincent and the Grenadines | 30.3 /100 | #187 | Fair 2.2% |
| Guyanese | 28.9 /100 | #188 | Fair 2.2% |
| Salvadorans | 27.4 /100 | #189 | Fair 2.2% |
| Immigrants | Costa Rica | 26.1 /100 | #190 | Fair 2.2% |
| Canadians | 25.8 /100 | #191 | Fair 2.2% |