Lebanese vs French Canadian Vision Disability
COMPARE
Lebanese
French Canadian
Vision Disability
Vision Disability Comparison
Lebanese
French Canadians
2.2%
VISION DISABILITY
54.3/ 100
METRIC RATING
171st/ 347
METRIC RANK
2.3%
VISION DISABILITY
3.9/ 100
METRIC RATING
221st/ 347
METRIC RANK
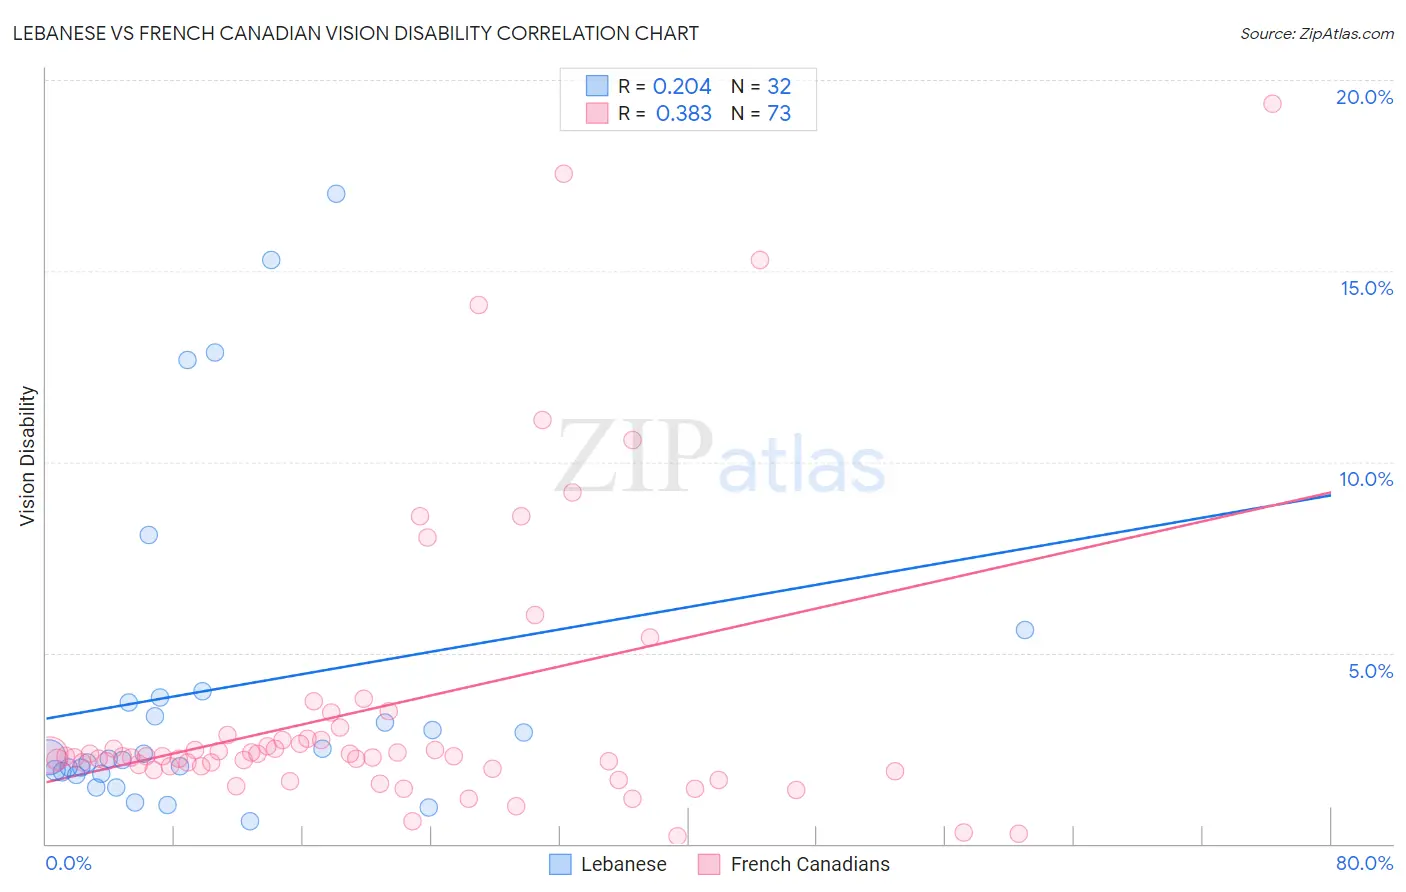
Lebanese vs French Canadian Vision Disability Correlation Chart
The statistical analysis conducted on geographies consisting of 401,298,237 people shows a weak positive correlation between the proportion of Lebanese and percentage of population with vision disability in the United States with a correlation coefficient (R) of 0.204 and weighted average of 2.2%. Similarly, the statistical analysis conducted on geographies consisting of 501,700,767 people shows a mild positive correlation between the proportion of French Canadians and percentage of population with vision disability in the United States with a correlation coefficient (R) of 0.383 and weighted average of 2.3%, a difference of 5.3%.
Vision Disability Correlation Summary
| Measurement | Lebanese | French Canadian |
| Minimum | 0.58% | 0.20% |
| Maximum | 17.0% | 19.4% |
| Range | 16.4% | 19.2% |
| Mean | 4.0% | 3.6% |
| Median | 2.3% | 2.3% |
| Interquartile 25% (IQ1) | 1.9% | 2.0% |
| Interquartile 75% (IQ3) | 3.8% | 2.8% |
| Interquartile Range (IQR) | 1.9% | 0.79% |
| Standard Deviation (Sample) | 4.3% | 3.9% |
| Standard Deviation (Population) | 4.2% | 3.8% |
Similar Demographics by Vision Disability
Demographics Similar to Lebanese by Vision Disability
In terms of vision disability, the demographic groups most similar to Lebanese are Swiss (2.2%, a difference of 0.090%), South American Indian (2.2%, a difference of 0.20%), Northern European (2.2%, a difference of 0.26%), Scandinavian (2.2%, a difference of 0.27%), and Immigrants from Canada (2.2%, a difference of 0.27%).
| Demographics | Rating | Rank | Vision Disability |
| Immigrants | Bangladesh | 65.5 /100 | #164 | Good 2.1% |
| Immigrants | Iraq | 64.8 /100 | #165 | Good 2.1% |
| Immigrants | England | 62.8 /100 | #166 | Good 2.1% |
| Immigrants | Africa | 62.6 /100 | #167 | Good 2.1% |
| Brazilians | 62.2 /100 | #168 | Good 2.1% |
| South American Indians | 57.4 /100 | #169 | Average 2.2% |
| Swiss | 55.7 /100 | #170 | Average 2.2% |
| Lebanese | 54.3 /100 | #171 | Average 2.2% |
| Northern Europeans | 50.1 /100 | #172 | Average 2.2% |
| Scandinavians | 50.0 /100 | #173 | Average 2.2% |
| Immigrants | Canada | 50.0 /100 | #174 | Average 2.2% |
| Immigrants | Fiji | 47.6 /100 | #175 | Average 2.2% |
| Yugoslavians | 46.5 /100 | #176 | Average 2.2% |
| Slavs | 46.0 /100 | #177 | Average 2.2% |
| Immigrants | Oceania | 45.1 /100 | #178 | Average 2.2% |
Demographics Similar to French Canadians by Vision Disability
In terms of vision disability, the demographic groups most similar to French Canadians are Guamanian/Chamorro (2.3%, a difference of 0.020%), Immigrants from Senegal (2.3%, a difference of 0.020%), Basque (2.3%, a difference of 0.16%), Irish (2.3%, a difference of 0.19%), and Immigrants from Western Africa (2.3%, a difference of 0.20%).
| Demographics | Rating | Rank | Vision Disability |
| Trinidadians and Tobagonians | 8.2 /100 | #214 | Tragic 2.2% |
| Nigerians | 7.2 /100 | #215 | Tragic 2.3% |
| Immigrants | Trinidad and Tobago | 6.1 /100 | #216 | Tragic 2.3% |
| Barbadians | 5.1 /100 | #217 | Tragic 2.3% |
| Portuguese | 4.9 /100 | #218 | Tragic 2.3% |
| Ecuadorians | 4.6 /100 | #219 | Tragic 2.3% |
| Guamanians/Chamorros | 3.9 /100 | #220 | Tragic 2.3% |
| French Canadians | 3.9 /100 | #221 | Tragic 2.3% |
| Immigrants | Senegal | 3.8 /100 | #222 | Tragic 2.3% |
| Basques | 3.5 /100 | #223 | Tragic 2.3% |
| Irish | 3.4 /100 | #224 | Tragic 2.3% |
| Immigrants | Western Africa | 3.4 /100 | #225 | Tragic 2.3% |
| Immigrants | Germany | 3.0 /100 | #226 | Tragic 2.3% |
| Hawaiians | 2.9 /100 | #227 | Tragic 2.3% |
| Hmong | 2.5 /100 | #228 | Tragic 2.3% |