Japanese vs Immigrants from Greece Male Disability
COMPARE
Japanese
Immigrants from Greece
Male Disability
Male Disability Comparison
Japanese
Immigrants from Greece
11.7%
MALE DISABILITY
3.1/ 100
METRIC RATING
224th/ 347
METRIC RANK
10.7%
MALE DISABILITY
95.6/ 100
METRIC RATING
101st/ 347
METRIC RANK
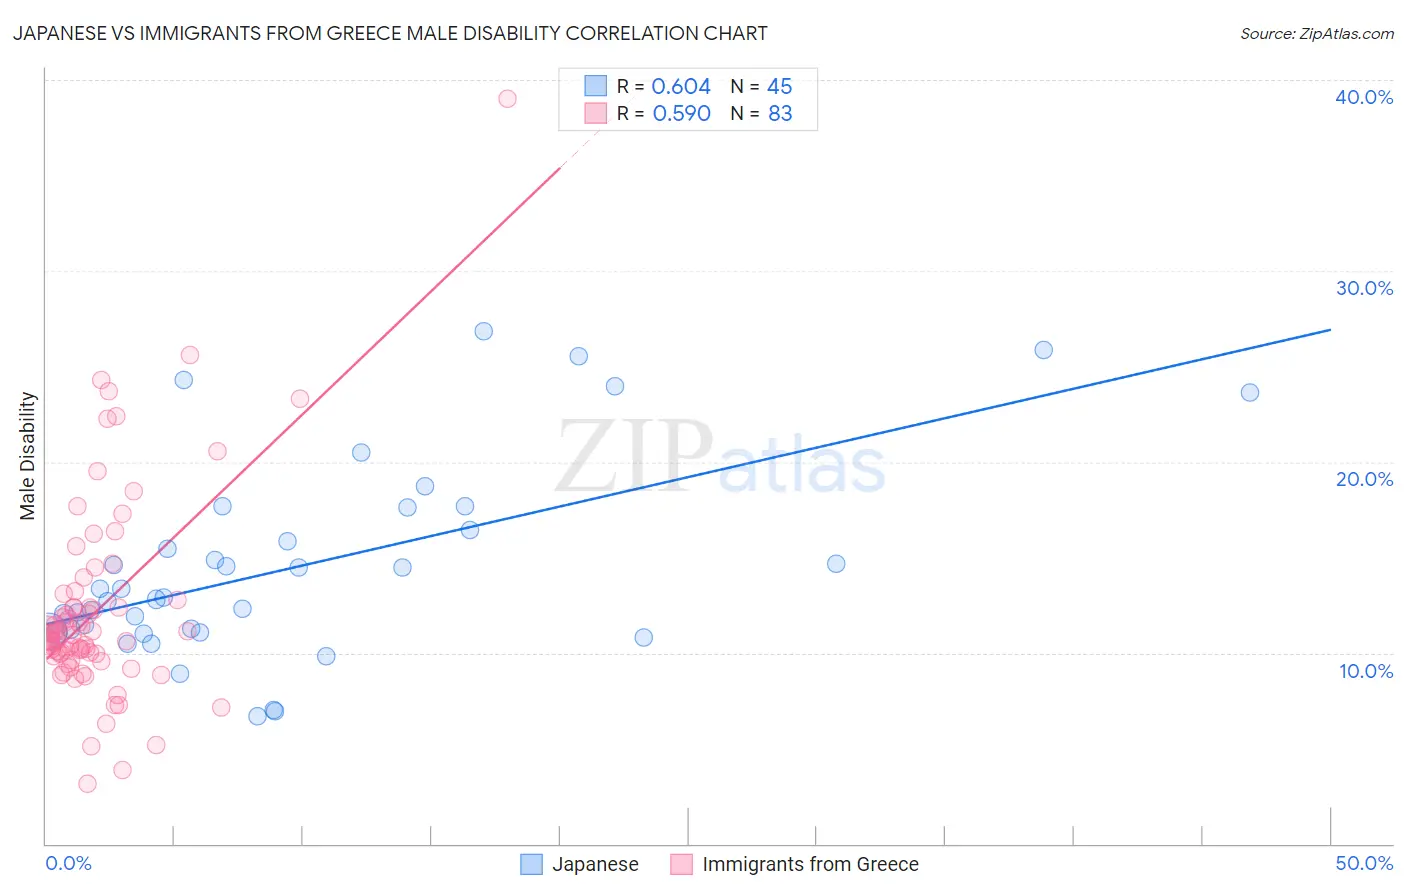
Japanese vs Immigrants from Greece Male Disability Correlation Chart
The statistical analysis conducted on geographies consisting of 249,159,975 people shows a significant positive correlation between the proportion of Japanese and percentage of males with a disability in the United States with a correlation coefficient (R) of 0.604 and weighted average of 11.7%. Similarly, the statistical analysis conducted on geographies consisting of 216,877,187 people shows a substantial positive correlation between the proportion of Immigrants from Greece and percentage of males with a disability in the United States with a correlation coefficient (R) of 0.590 and weighted average of 10.7%, a difference of 9.4%.
Male Disability Correlation Summary
| Measurement | Japanese | Immigrants from Greece |
| Minimum | 6.7% | 3.1% |
| Maximum | 26.9% | 39.0% |
| Range | 20.2% | 35.9% |
| Mean | 14.5% | 12.3% |
| Median | 12.9% | 11.0% |
| Interquartile 25% (IQ1) | 11.1% | 9.8% |
| Interquartile 75% (IQ3) | 17.0% | 12.8% |
| Interquartile Range (IQR) | 5.9% | 2.9% |
| Standard Deviation (Sample) | 5.1% | 5.4% |
| Standard Deviation (Population) | 5.1% | 5.3% |
Similar Demographics by Male Disability
Demographics Similar to Japanese by Male Disability
In terms of male disability, the demographic groups most similar to Japanese are Liberian (11.8%, a difference of 0.010%), Immigrants from Bahamas (11.7%, a difference of 0.020%), Alsatian (11.7%, a difference of 0.11%), Subsaharan African (11.8%, a difference of 0.13%), and Immigrants from Congo (11.7%, a difference of 0.26%).
| Demographics | Rating | Rank | Male Disability |
| Immigrants | Dominica | 4.6 /100 | #217 | Tragic 11.7% |
| Immigrants | England | 4.0 /100 | #218 | Tragic 11.7% |
| Panamanians | 3.8 /100 | #219 | Tragic 11.7% |
| Immigrants | Western Europe | 3.8 /100 | #220 | Tragic 11.7% |
| Immigrants | Congo | 3.7 /100 | #221 | Tragic 11.7% |
| Alsatians | 3.3 /100 | #222 | Tragic 11.7% |
| Immigrants | Bahamas | 3.2 /100 | #223 | Tragic 11.7% |
| Japanese | 3.1 /100 | #224 | Tragic 11.7% |
| Liberians | 3.1 /100 | #225 | Tragic 11.8% |
| Sub-Saharan Africans | 2.8 /100 | #226 | Tragic 11.8% |
| Austrians | 2.5 /100 | #227 | Tragic 11.8% |
| Hispanics or Latinos | 2.3 /100 | #228 | Tragic 11.8% |
| Bermudans | 2.3 /100 | #229 | Tragic 11.8% |
| Croatians | 2.1 /100 | #230 | Tragic 11.8% |
| Dominicans | 1.8 /100 | #231 | Tragic 11.8% |
Demographics Similar to Immigrants from Greece by Male Disability
In terms of male disability, the demographic groups most similar to Immigrants from Greece are Immigrants from Eastern Europe (10.7%, a difference of 0.10%), Immigrants from Kazakhstan (10.7%, a difference of 0.11%), Uruguayan (10.7%, a difference of 0.11%), Immigrants from Nigeria (10.8%, a difference of 0.17%), and Immigrants from Switzerland (10.7%, a difference of 0.18%).
| Demographics | Rating | Rank | Male Disability |
| Immigrants | Sweden | 96.9 /100 | #94 | Exceptional 10.7% |
| Chileans | 96.9 /100 | #95 | Exceptional 10.7% |
| Nicaraguans | 96.6 /100 | #96 | Exceptional 10.7% |
| Immigrants | Armenia | 96.6 /100 | #97 | Exceptional 10.7% |
| Immigrants | Romania | 96.5 /100 | #98 | Exceptional 10.7% |
| Immigrants | Switzerland | 96.1 /100 | #99 | Exceptional 10.7% |
| Immigrants | Kazakhstan | 95.9 /100 | #100 | Exceptional 10.7% |
| Immigrants | Greece | 95.6 /100 | #101 | Exceptional 10.7% |
| Immigrants | Eastern Europe | 95.3 /100 | #102 | Exceptional 10.7% |
| Uruguayans | 95.3 /100 | #103 | Exceptional 10.7% |
| Immigrants | Nigeria | 95.1 /100 | #104 | Exceptional 10.8% |
| Immigrants | Brazil | 95.0 /100 | #105 | Exceptional 10.8% |
| Immigrants | Syria | 94.9 /100 | #106 | Exceptional 10.8% |
| Immigrants | Eastern Africa | 94.3 /100 | #107 | Exceptional 10.8% |
| Immigrants | Belgium | 94.2 /100 | #108 | Exceptional 10.8% |