Immigrants vs Ugandan Ambulatory Disability
COMPARE
Immigrants
Ugandan
Ambulatory Disability
Ambulatory Disability Comparison
Immigrants
Ugandans
6.0%
AMBULATORY DISABILITY
86.9/ 100
METRIC RATING
133rd/ 347
METRIC RANK
5.7%
AMBULATORY DISABILITY
99.2/ 100
METRIC RATING
84th/ 347
METRIC RANK
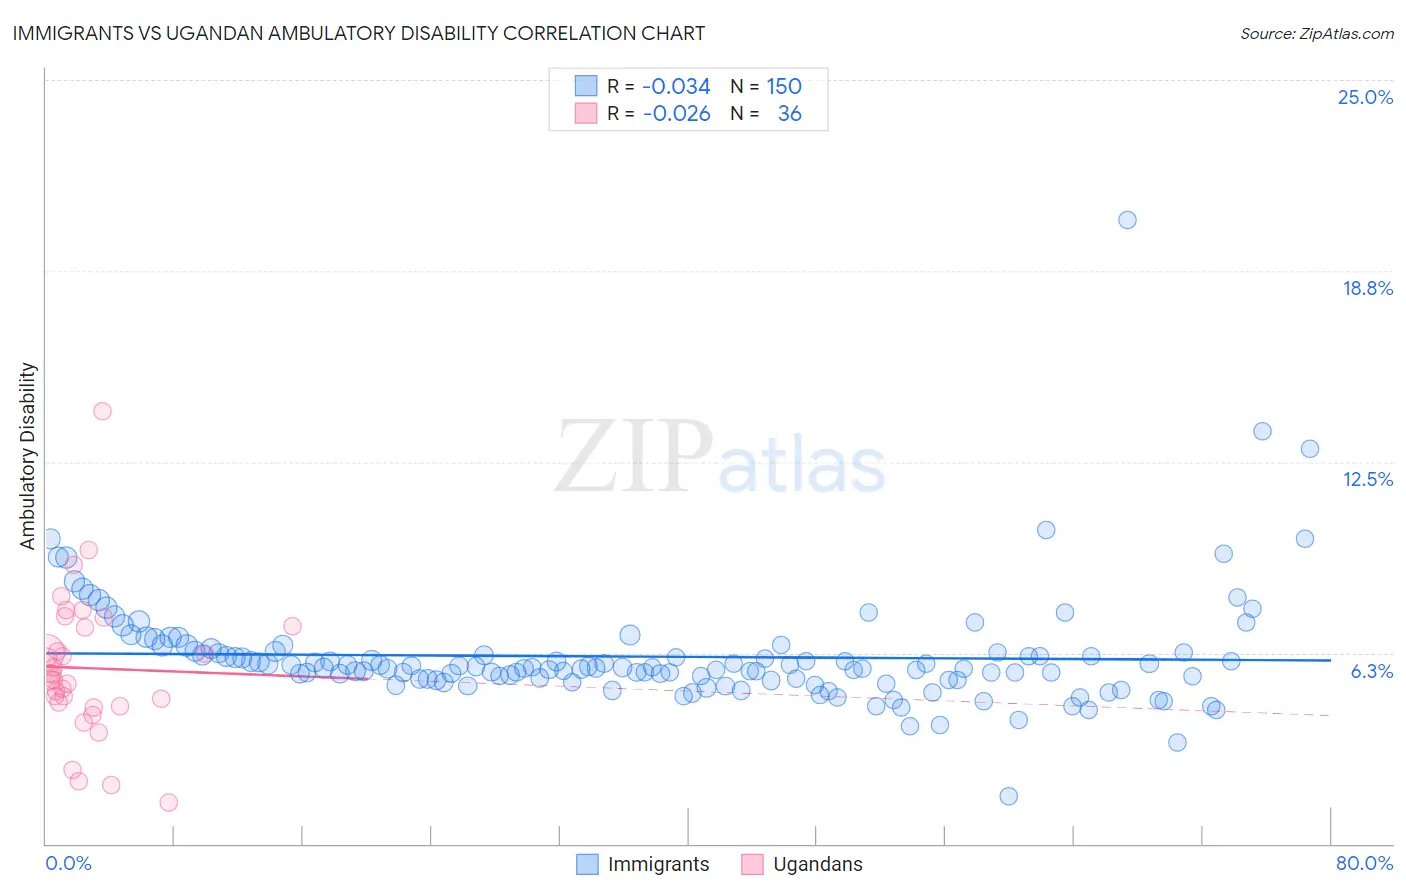
Immigrants vs Ugandan Ambulatory Disability Correlation Chart
The statistical analysis conducted on geographies consisting of 577,108,062 people shows no correlation between the proportion of Immigrants and percentage of population with ambulatory disability in the United States with a correlation coefficient (R) of -0.034 and weighted average of 6.0%. Similarly, the statistical analysis conducted on geographies consisting of 94,018,396 people shows no correlation between the proportion of Ugandans and percentage of population with ambulatory disability in the United States with a correlation coefficient (R) of -0.026 and weighted average of 5.7%, a difference of 4.1%.
Ambulatory Disability Correlation Summary
| Measurement | Immigrants | Ugandan |
| Minimum | 1.6% | 1.4% |
| Maximum | 20.4% | 14.2% |
| Range | 18.8% | 12.8% |
| Mean | 6.1% | 5.7% |
| Median | 5.8% | 5.5% |
| Interquartile 25% (IQ1) | 5.4% | 4.6% |
| Interquartile 75% (IQ3) | 6.2% | 7.1% |
| Interquartile Range (IQR) | 0.89% | 2.5% |
| Standard Deviation (Sample) | 1.9% | 2.4% |
| Standard Deviation (Population) | 1.9% | 2.3% |
Similar Demographics by Ambulatory Disability
Demographics Similar to Immigrants by Ambulatory Disability
In terms of ambulatory disability, the demographic groups most similar to Immigrants are Ute (6.0%, a difference of 0.040%), Immigrants from Europe (6.0%, a difference of 0.11%), Immigrants from Italy (6.0%, a difference of 0.22%), Immigrants from North Macedonia (6.0%, a difference of 0.31%), and Immigrants from Syria (6.0%, a difference of 0.31%).
| Demographics | Rating | Rank | Ambulatory Disability |
| Arabs | 91.5 /100 | #126 | Exceptional 5.9% |
| Immigrants | Nigeria | 90.9 /100 | #127 | Exceptional 5.9% |
| Immigrants | Western Asia | 90.7 /100 | #128 | Exceptional 5.9% |
| Immigrants | Norway | 90.5 /100 | #129 | Exceptional 5.9% |
| Immigrants | Kazakhstan | 89.7 /100 | #130 | Excellent 5.9% |
| Immigrants | Costa Rica | 89.5 /100 | #131 | Excellent 5.9% |
| Immigrants | Europe | 87.8 /100 | #132 | Excellent 6.0% |
| Immigrants | Immigrants | 86.9 /100 | #133 | Excellent 6.0% |
| Ute | 86.6 /100 | #134 | Excellent 6.0% |
| Immigrants | Italy | 85.0 /100 | #135 | Excellent 6.0% |
| Immigrants | North Macedonia | 84.1 /100 | #136 | Excellent 6.0% |
| Immigrants | Syria | 84.1 /100 | #137 | Excellent 6.0% |
| Immigrants | Hungary | 83.9 /100 | #138 | Excellent 6.0% |
| Immigrants | Zaire | 83.6 /100 | #139 | Excellent 6.0% |
| Czechs | 83.3 /100 | #140 | Excellent 6.0% |
Demographics Similar to Ugandans by Ambulatory Disability
In terms of ambulatory disability, the demographic groups most similar to Ugandans are Eastern European (5.7%, a difference of 0.0%), Palestinian (5.7%, a difference of 0.020%), Immigrants from Ireland (5.7%, a difference of 0.030%), Immigrants from Jordan (5.7%, a difference of 0.030%), and Chilean (5.7%, a difference of 0.16%).
| Demographics | Rating | Rank | Ambulatory Disability |
| Immigrants | Vietnam | 99.3 /100 | #77 | Exceptional 5.7% |
| Somalis | 99.2 /100 | #78 | Exceptional 5.7% |
| Chileans | 99.2 /100 | #79 | Exceptional 5.7% |
| Immigrants | Ireland | 99.2 /100 | #80 | Exceptional 5.7% |
| Immigrants | Jordan | 99.2 /100 | #81 | Exceptional 5.7% |
| Palestinians | 99.2 /100 | #82 | Exceptional 5.7% |
| Eastern Europeans | 99.2 /100 | #83 | Exceptional 5.7% |
| Ugandans | 99.2 /100 | #84 | Exceptional 5.7% |
| South Americans | 99.0 /100 | #85 | Exceptional 5.7% |
| Latvians | 99.0 /100 | #86 | Exceptional 5.7% |
| Immigrants | Chile | 98.9 /100 | #87 | Exceptional 5.8% |
| Soviet Union | 98.9 /100 | #88 | Exceptional 5.8% |
| Bhutanese | 98.8 /100 | #89 | Exceptional 5.8% |
| Australians | 98.8 /100 | #90 | Exceptional 5.8% |
| Immigrants | Sudan | 98.8 /100 | #91 | Exceptional 5.8% |