Immigrants from Western Europe vs Samoan Disability
COMPARE
Immigrants from Western Europe
Samoan
Disability
Disability Comparison
Immigrants from Western Europe
Samoans
12.0%
DISABILITY
10.1/ 100
METRIC RATING
205th/ 347
METRIC RANK
12.2%
DISABILITY
2.6/ 100
METRIC RATING
230th/ 347
METRIC RANK
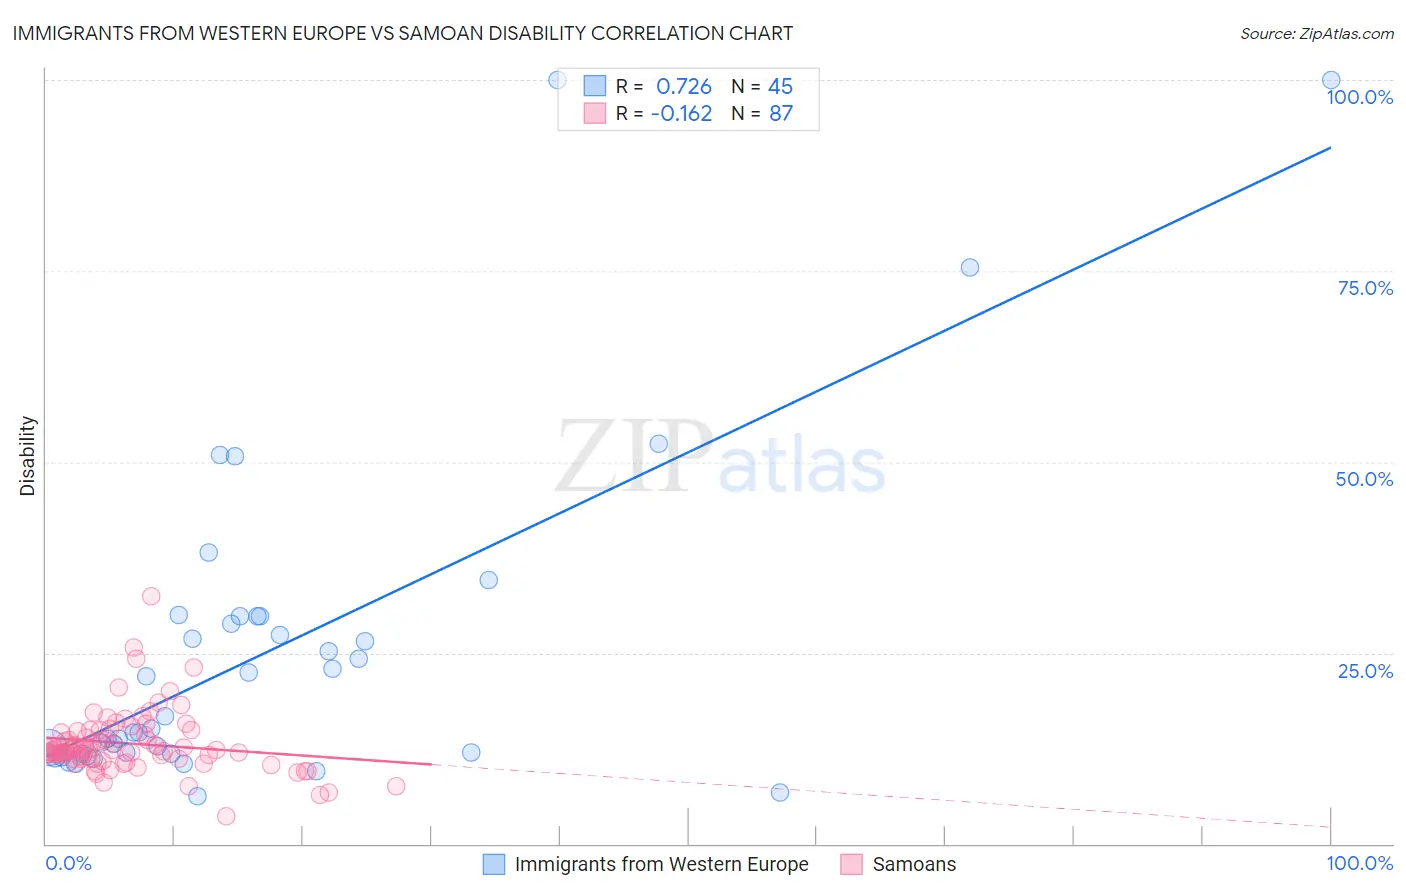
Immigrants from Western Europe vs Samoan Disability Correlation Chart
The statistical analysis conducted on geographies consisting of 494,041,803 people shows a strong positive correlation between the proportion of Immigrants from Western Europe and percentage of population with a disability in the United States with a correlation coefficient (R) of 0.726 and weighted average of 12.0%. Similarly, the statistical analysis conducted on geographies consisting of 225,125,318 people shows a poor negative correlation between the proportion of Samoans and percentage of population with a disability in the United States with a correlation coefficient (R) of -0.162 and weighted average of 12.2%, a difference of 1.5%.
Disability Correlation Summary
| Measurement | Immigrants from Western Europe | Samoan |
| Minimum | 6.3% | 3.6% |
| Maximum | 100.0% | 32.5% |
| Range | 93.7% | 28.8% |
| Mean | 25.2% | 13.1% |
| Median | 15.0% | 12.3% |
| Interquartile 25% (IQ1) | 11.7% | 11.1% |
| Interquartile 75% (IQ3) | 29.8% | 14.7% |
| Interquartile Range (IQR) | 18.0% | 3.6% |
| Standard Deviation (Sample) | 21.6% | 4.1% |
| Standard Deviation (Population) | 21.3% | 4.1% |
Similar Demographics by Disability
Demographics Similar to Immigrants from Western Europe by Disability
In terms of disability, the demographic groups most similar to Immigrants from Western Europe are Immigrants from Senegal (12.0%, a difference of 0.080%), Immigrants from Thailand (12.0%, a difference of 0.10%), Immigrants from Caribbean (12.0%, a difference of 0.12%), British West Indian (12.0%, a difference of 0.16%), and Mexican American Indian (12.0%, a difference of 0.16%).
| Demographics | Rating | Rank | Disability |
| Ukrainians | 14.7 /100 | #198 | Poor 11.9% |
| Immigrants | Panama | 14.6 /100 | #199 | Poor 11.9% |
| Belizeans | 12.8 /100 | #200 | Poor 11.9% |
| Assyrians/Chaldeans/Syriacs | 12.6 /100 | #201 | Poor 11.9% |
| Immigrants | England | 12.0 /100 | #202 | Poor 12.0% |
| British West Indians | 11.5 /100 | #203 | Poor 12.0% |
| Mexican American Indians | 11.4 /100 | #204 | Poor 12.0% |
| Immigrants | Western Europe | 10.1 /100 | #205 | Poor 12.0% |
| Immigrants | Senegal | 9.4 /100 | #206 | Tragic 12.0% |
| Immigrants | Thailand | 9.3 /100 | #207 | Tragic 12.0% |
| Immigrants | Caribbean | 9.1 /100 | #208 | Tragic 12.0% |
| Danes | 8.7 /100 | #209 | Tragic 12.0% |
| Czechs | 7.9 /100 | #210 | Tragic 12.0% |
| Immigrants | Cambodia | 7.3 /100 | #211 | Tragic 12.0% |
| Austrians | 7.2 /100 | #212 | Tragic 12.0% |
Demographics Similar to Samoans by Disability
In terms of disability, the demographic groups most similar to Samoans are Malaysian (12.2%, a difference of 0.030%), Italian (12.2%, a difference of 0.040%), Inupiat (12.2%, a difference of 0.080%), West Indian (12.2%, a difference of 0.10%), and Bahamian (12.2%, a difference of 0.13%).
| Demographics | Rating | Rank | Disability |
| Hispanics or Latinos | 3.9 /100 | #223 | Tragic 12.1% |
| Mexicans | 3.7 /100 | #224 | Tragic 12.1% |
| Senegalese | 3.5 /100 | #225 | Tragic 12.1% |
| Jamaicans | 3.3 /100 | #226 | Tragic 12.1% |
| Alsatians | 3.3 /100 | #227 | Tragic 12.1% |
| West Indians | 2.9 /100 | #228 | Tragic 12.2% |
| Inupiat | 2.8 /100 | #229 | Tragic 12.2% |
| Samoans | 2.6 /100 | #230 | Tragic 12.2% |
| Malaysians | 2.5 /100 | #231 | Tragic 12.2% |
| Italians | 2.5 /100 | #232 | Tragic 12.2% |
| Bahamians | 2.3 /100 | #233 | Tragic 12.2% |
| Japanese | 2.3 /100 | #234 | Tragic 12.2% |
| Yup'ik | 2.2 /100 | #235 | Tragic 12.2% |
| Chinese | 2.0 /100 | #236 | Tragic 12.2% |
| Immigrants | Congo | 1.9 /100 | #237 | Tragic 12.2% |