Immigrants from Western Africa vs Somali Disability
COMPARE
Immigrants from Western Africa
Somali
Disability
Disability Comparison
Immigrants from Western Africa
Somalis
11.7%
DISABILITY
47.5/ 100
METRIC RATING
176th/ 347
METRIC RANK
11.9%
DISABILITY
17.3/ 100
METRIC RATING
194th/ 347
METRIC RANK
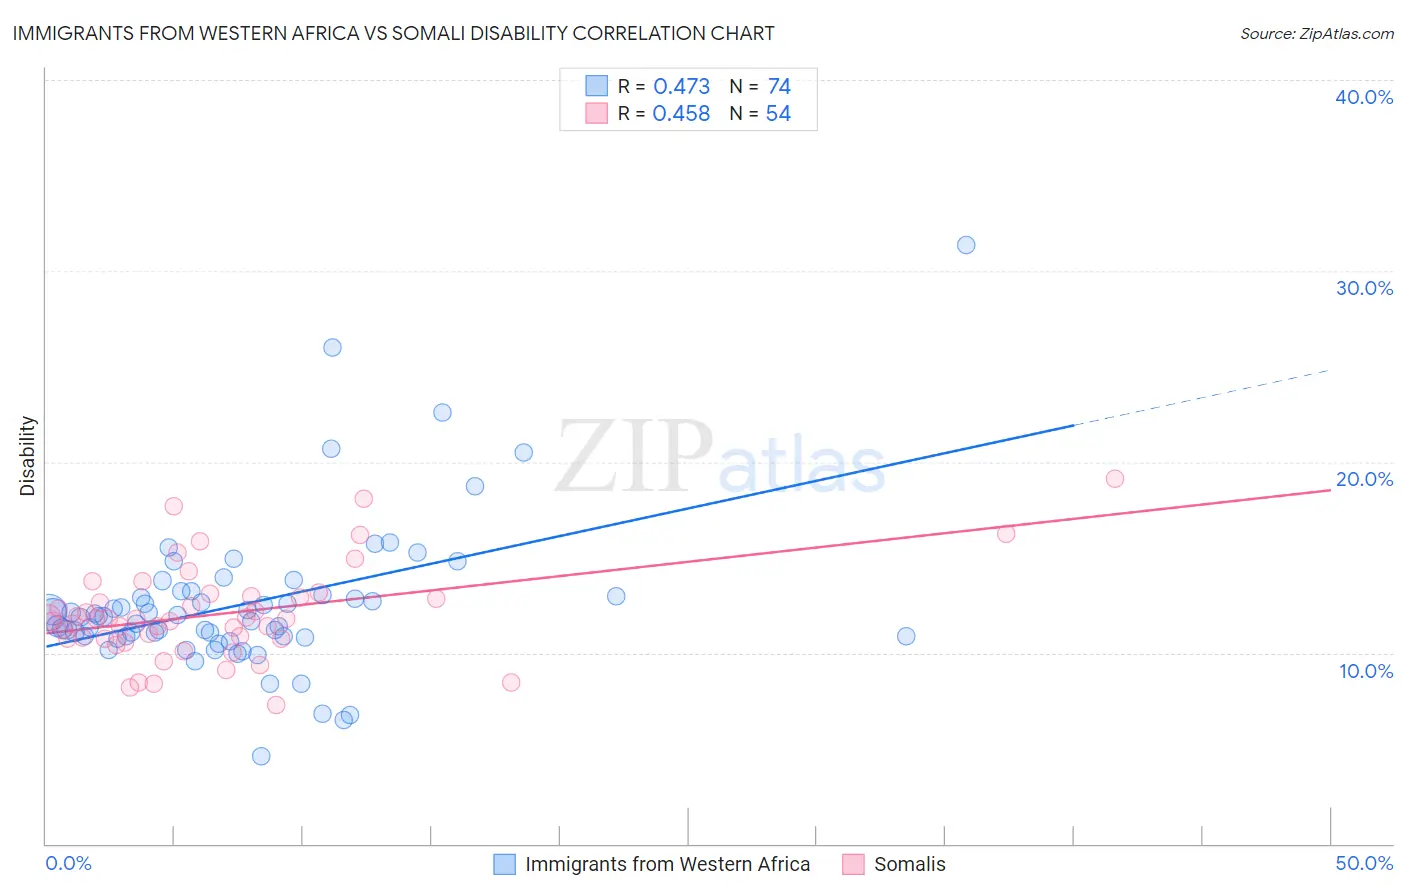
Immigrants from Western Africa vs Somali Disability Correlation Chart
The statistical analysis conducted on geographies consisting of 357,817,429 people shows a moderate positive correlation between the proportion of Immigrants from Western Africa and percentage of population with a disability in the United States with a correlation coefficient (R) of 0.473 and weighted average of 11.7%. Similarly, the statistical analysis conducted on geographies consisting of 99,315,749 people shows a moderate positive correlation between the proportion of Somalis and percentage of population with a disability in the United States with a correlation coefficient (R) of 0.458 and weighted average of 11.9%, a difference of 1.6%.
Disability Correlation Summary
| Measurement | Immigrants from Western Africa | Somali |
| Minimum | 4.6% | 7.3% |
| Maximum | 31.3% | 19.1% |
| Range | 26.7% | 11.8% |
| Mean | 12.6% | 12.0% |
| Median | 11.9% | 11.8% |
| Interquartile 25% (IQ1) | 10.9% | 10.8% |
| Interquartile 75% (IQ3) | 13.0% | 12.9% |
| Interquartile Range (IQR) | 2.2% | 2.2% |
| Standard Deviation (Sample) | 4.0% | 2.5% |
| Standard Deviation (Population) | 4.0% | 2.5% |
Demographics Similar to Immigrants from Western Africa and Somalis by Disability
In terms of disability, the demographic groups most similar to Immigrants from Western Africa are Immigrants from Central America (11.7%, a difference of 0.040%), Haitian (11.7%, a difference of 0.050%), Greek (11.7%, a difference of 0.060%), Immigrants from Armenia (11.7%, a difference of 0.25%), and Immigrants from Honduras (11.8%, a difference of 0.44%). Similarly, the demographic groups most similar to Somalis are Immigrants from Bosnia and Herzegovina (11.9%, a difference of 0.050%), Lithuanian (11.9%, a difference of 0.11%), Barbadian (11.9%, a difference of 0.11%), Ute (11.9%, a difference of 0.16%), and Immigrants from West Indies (11.9%, a difference of 0.27%).
| Demographics | Rating | Rank | Disability |
| Haitians | 48.6 /100 | #175 | Average 11.7% |
| Immigrants | Western Africa | 47.5 /100 | #176 | Average 11.7% |
| Immigrants | Central America | 46.6 /100 | #177 | Average 11.7% |
| Greeks | 46.2 /100 | #178 | Average 11.7% |
| Immigrants | Armenia | 41.9 /100 | #179 | Average 11.7% |
| Immigrants | Honduras | 37.8 /100 | #180 | Fair 11.8% |
| Immigrants | Oceania | 34.3 /100 | #181 | Fair 11.8% |
| Icelanders | 34.0 /100 | #182 | Fair 11.8% |
| Hondurans | 31.2 /100 | #183 | Fair 11.8% |
| Iraqis | 30.0 /100 | #184 | Fair 11.8% |
| Immigrants | Burma/Myanmar | 28.5 /100 | #185 | Fair 11.8% |
| Immigrants | Scotland | 28.2 /100 | #186 | Fair 11.8% |
| Lebanese | 27.9 /100 | #187 | Fair 11.8% |
| Immigrants | Mexico | 23.8 /100 | #188 | Fair 11.9% |
| Immigrants | Zaire | 21.8 /100 | #189 | Fair 11.9% |
| Immigrants | West Indies | 21.1 /100 | #190 | Fair 11.9% |
| Ute | 19.5 /100 | #191 | Poor 11.9% |
| Lithuanians | 18.8 /100 | #192 | Poor 11.9% |
| Immigrants | Bosnia and Herzegovina | 18.0 /100 | #193 | Poor 11.9% |
| Somalis | 17.3 /100 | #194 | Poor 11.9% |
| Barbadians | 15.8 /100 | #195 | Poor 11.9% |