Immigrants from West Indies vs Immigrants from India Disability
COMPARE
Immigrants from West Indies
Immigrants from India
Disability
Disability Comparison
Immigrants from West Indies
Immigrants from India
11.9%
DISABILITY
21.1/ 100
METRIC RATING
190th/ 347
METRIC RANK
9.5%
DISABILITY
100.0/ 100
METRIC RATING
1st/ 347
METRIC RANK
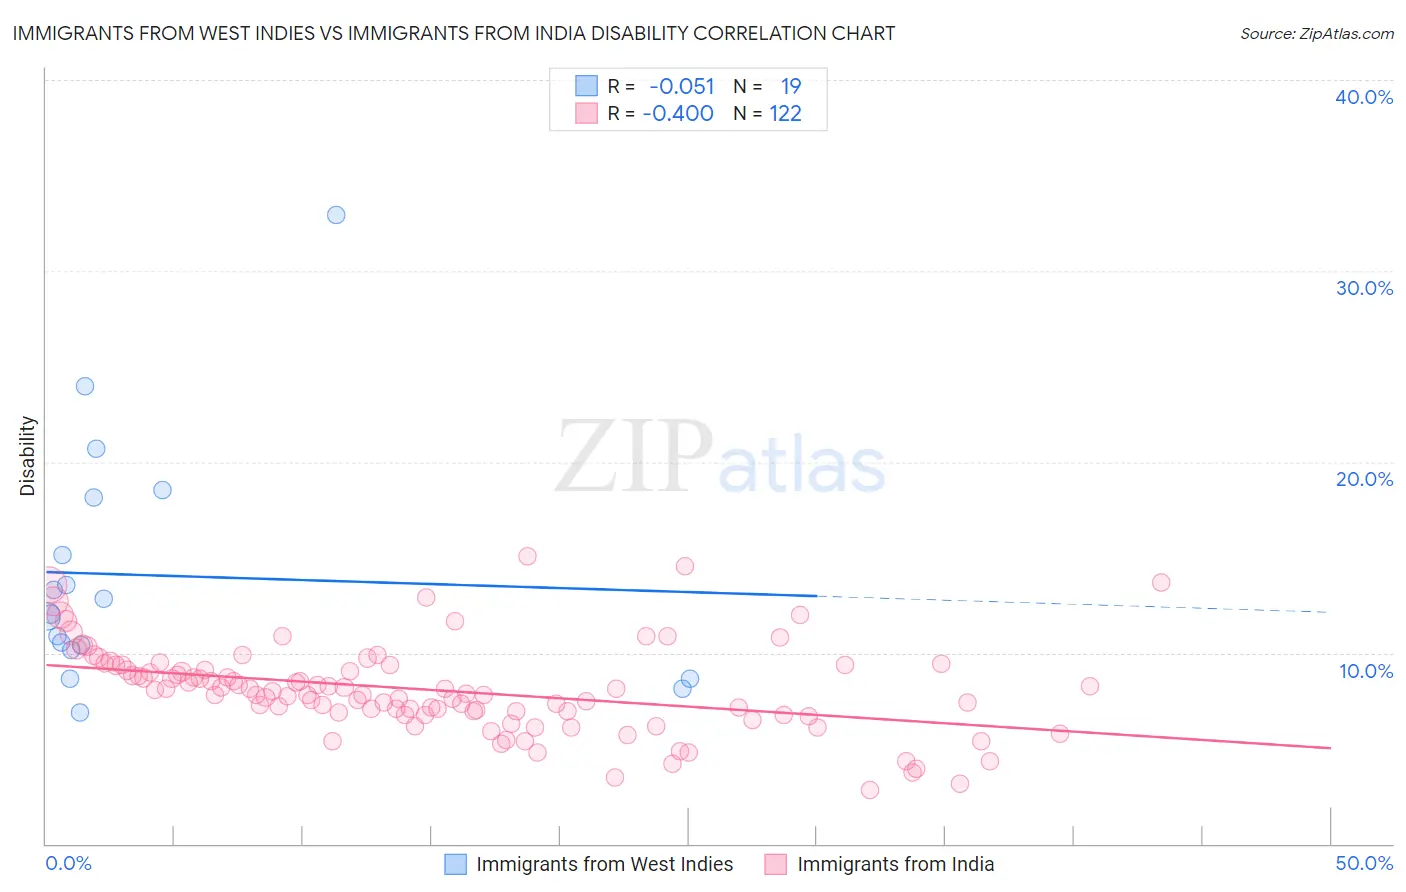
Immigrants from West Indies vs Immigrants from India Disability Correlation Chart
The statistical analysis conducted on geographies consisting of 72,456,461 people shows a slight negative correlation between the proportion of Immigrants from West Indies and percentage of population with a disability in the United States with a correlation coefficient (R) of -0.051 and weighted average of 11.9%. Similarly, the statistical analysis conducted on geographies consisting of 434,094,669 people shows a mild negative correlation between the proportion of Immigrants from India and percentage of population with a disability in the United States with a correlation coefficient (R) of -0.400 and weighted average of 9.5%, a difference of 24.9%.
Disability Correlation Summary
| Measurement | Immigrants from West Indies | Immigrants from India |
| Minimum | 6.9% | 2.8% |
| Maximum | 32.9% | 15.1% |
| Range | 26.0% | 12.2% |
| Mean | 14.1% | 8.1% |
| Median | 12.0% | 7.9% |
| Interquartile 25% (IQ1) | 10.1% | 6.9% |
| Interquartile 75% (IQ3) | 18.1% | 9.3% |
| Interquartile Range (IQR) | 8.0% | 2.4% |
| Standard Deviation (Sample) | 6.4% | 2.3% |
| Standard Deviation (Population) | 6.3% | 2.3% |
Similar Demographics by Disability
Demographics Similar to Immigrants from West Indies by Disability
In terms of disability, the demographic groups most similar to Immigrants from West Indies are Immigrants from Zaire (11.9%, a difference of 0.050%), Ute (11.9%, a difference of 0.11%), Lithuanian (11.9%, a difference of 0.16%), Immigrants from Mexico (11.9%, a difference of 0.17%), and Immigrants from Bosnia and Herzegovina (11.9%, a difference of 0.21%).
| Demographics | Rating | Rank | Disability |
| Hondurans | 31.2 /100 | #183 | Fair 11.8% |
| Iraqis | 30.0 /100 | #184 | Fair 11.8% |
| Immigrants | Burma/Myanmar | 28.5 /100 | #185 | Fair 11.8% |
| Immigrants | Scotland | 28.2 /100 | #186 | Fair 11.8% |
| Lebanese | 27.9 /100 | #187 | Fair 11.8% |
| Immigrants | Mexico | 23.8 /100 | #188 | Fair 11.9% |
| Immigrants | Zaire | 21.8 /100 | #189 | Fair 11.9% |
| Immigrants | West Indies | 21.1 /100 | #190 | Fair 11.9% |
| Ute | 19.5 /100 | #191 | Poor 11.9% |
| Lithuanians | 18.8 /100 | #192 | Poor 11.9% |
| Immigrants | Bosnia and Herzegovina | 18.0 /100 | #193 | Poor 11.9% |
| Somalis | 17.3 /100 | #194 | Poor 11.9% |
| Barbadians | 15.8 /100 | #195 | Poor 11.9% |
| Serbians | 15.4 /100 | #196 | Poor 11.9% |
| Immigrants | Belize | 15.2 /100 | #197 | Poor 11.9% |
Demographics Similar to Immigrants from India by Disability
In terms of disability, the demographic groups most similar to Immigrants from India are Filipino (9.6%, a difference of 0.98%), Immigrants from Taiwan (9.6%, a difference of 1.1%), Thai (9.7%, a difference of 2.1%), Immigrants from Bolivia (9.9%, a difference of 3.8%), and Immigrants from South Central Asia (9.9%, a difference of 4.7%).
| Demographics | Rating | Rank | Disability |
| Immigrants | India | 100.0 /100 | #1 | Exceptional 9.5% |
| Filipinos | 100.0 /100 | #2 | Exceptional 9.6% |
| Immigrants | Taiwan | 100.0 /100 | #3 | Exceptional 9.6% |
| Thais | 100.0 /100 | #4 | Exceptional 9.7% |
| Immigrants | Bolivia | 100.0 /100 | #5 | Exceptional 9.9% |
| Immigrants | South Central Asia | 100.0 /100 | #6 | Exceptional 9.9% |
| Immigrants | Singapore | 100.0 /100 | #7 | Exceptional 10.0% |
| Bolivians | 100.0 /100 | #8 | Exceptional 10.0% |
| Immigrants | Hong Kong | 100.0 /100 | #9 | Exceptional 10.0% |
| Immigrants | China | 100.0 /100 | #10 | Exceptional 10.1% |
| Iranians | 100.0 /100 | #11 | Exceptional 10.1% |
| Immigrants | Israel | 100.0 /100 | #12 | Exceptional 10.1% |
| Immigrants | Eastern Asia | 100.0 /100 | #13 | Exceptional 10.2% |
| Immigrants | Korea | 100.0 /100 | #14 | Exceptional 10.2% |
| Okinawans | 100.0 /100 | #15 | Exceptional 10.3% |