Cherokee vs Immigrants from India Disability

COMPARE

Cherokee
Race
Ancestry
AfghanAfricanAlaska NativeAlaskan AthabascanAlbanianAleutAlsatianAmericanApacheArabArapahoArgentineanArmenianAssyrian/Chaldean/SyriacAustralianAustrianBahamianBangladeshiBarbadianBasqueBelgianBelizeanBermudanBhutaneseBlackfeetBolivianBrazilianBritishBritish West IndianBulgarianBurmeseCajunCambodianCanadianCape VerdeanCarpatho RusynCelticCentral AmericanCentral American IndianCherokeeCheyenneChickasawChileanChineseChippewaChoctawColombianColvilleComancheCosta RicanCreeCreekCroatianCrowCubanCypriotCzechCzechoslovakianDanishDelawareDominicanDutchDutch West IndianEastern EuropeanEcuadorianEgyptianEnglishEstonianEthiopianEuropeanFijianFilipinoFinnishFrenchFrench American IndianFrench CanadianGermanGerman RussianGhanaianGreekGuamanian/ChamorroGuatemalanGuyaneseHaitianHmongHonduranHopiHoumaHungarianIcelanderIndian (Asian)IndonesianInupiatIranianIraqiIrishIroquoisIsraeliItalianJamaicanJapaneseJordanianKenyanKiowaKoreanLaotianLatvianLebaneseLiberianLithuanianLumbeeLuxembourgerMacedonianMalaysianMalteseMarshalleseMenomineeMexicanMexican American IndianMongolianMoroccanNative HawaiianNavajoNepaleseNew ZealanderNicaraguanNigerianNorthern EuropeanNorwegianOkinawanOsageOttawaPaiutePakistaniPalestinianPanamanianParaguayanPennsylvania GermanPeruvianPimaPolishPortuguesePotawatomiPuebloPuerto RicanPuget Sound SalishRomanianRussianSalvadoranSamoanScandinavianScotch-IrishScottishSeminoleSenegaleseSerbianShoshoneSierra LeoneanSiouxSlavicSlovakSloveneSomaliSouth AfricanSouth AmericanSouth American IndianSoviet UnionSpaniardSpanishSpanish AmericanSpanish American IndianSri LankanSubsaharan AfricanSudaneseSwedishSwissSyrianTaiwaneseThaiTlingit-HaidaTohono O'OdhamTonganTrinidadian and TobagonianTsimshianTurkishU.S. Virgin IslanderUgandanUkrainianUruguayanUteVenezuelanVietnameseWelshWest IndianYakamaYaquiYugoslavianYumanYup'ikZimbabwean
Immigration
NonimmigrantsImmigrantsAfghanistanAfricaAlbaniaArgentinaArmeniaAsiaAustraliaAustriaBahamasBangladeshBarbadosBelarusBelgiumBelizeBoliviaBosnia and HerzegovinaBrazilBulgariaBurma/MyanmarCabo VerdeCambodiaCameroonCanadaCaribbeanCentral AmericaChileChinaColombiaCongoCosta RicaCroatiaCubaCzechoslovakiaDenmarkDominicaDominican RepublicEastern AfricaEastern AsiaEastern EuropeEcuadorEgyptEl SalvadorEnglandEritreaEthiopiaEuropeFijiFranceGermanyGhanaGreeceGrenadaGuatemalaGuyanaHaitiHondurasHong KongHungaryIndonesiaIranIraqIrelandIsraelItalyJamaicaJapanJordanKazakhstanKenyaKoreaKuwaitLaosLatin AmericaLatviaLebanonLiberiaLithuaniaMalaysiaMexicoMicronesiaMiddle AfricaMoldovaMoroccoNepalNetherlandsNicaraguaNigeriaNorth AmericaNorth MacedoniaNorthern AfricaNorthern EuropeNorwayOceaniaPakistanPanamaPeruPhilippinesPolandPortugalRomaniaRussiaSaudi ArabiaScotlandSenegalSerbiaSierra LeoneSingaporeSomaliaSouth AfricaSouth AmericaSouth Central AsiaSouth Eastern AsiaSouthern EuropeSpainSri LankaSt. Vincent and the GrenadinesSudanSwedenSwitzerlandSyriaTaiwanThailandTrinidad and TobagoTurkeyUgandaUkraineUruguayUzbekistanVenezuelaVietnamWest IndiesWestern AfricaWestern AsiaWestern EuropeYemenZaireZimbabweAzores
Immigrants from India
Race
Ancestry
AfghanAfricanAlaska NativeAlaskan AthabascanAlbanianAleutAlsatianAmericanApacheArabArapahoArgentineanArmenianAssyrian/Chaldean/SyriacAustralianAustrianBahamianBangladeshiBarbadianBasqueBelgianBelizeanBermudanBhutaneseBlackfeetBolivianBrazilianBritishBritish West IndianBulgarianBurmeseCajunCambodianCanadianCape VerdeanCarpatho RusynCelticCentral AmericanCentral American IndianCheyenneChickasawChileanChineseChippewaChoctawColombianColvilleComancheCosta RicanCreeCreekCroatianCrowCubanCypriotCzechCzechoslovakianDanishDelawareDominicanDutchDutch West IndianEastern EuropeanEcuadorianEgyptianEnglishEstonianEthiopianEuropeanFijianFilipinoFinnishFrenchFrench American IndianFrench CanadianGermanGerman RussianGhanaianGreekGuamanian/ChamorroGuatemalanGuyaneseHaitianHmongHonduranHopiHoumaHungarianIcelanderIndian (Asian)IndonesianInupiatIranianIraqiIrishIroquoisIsraeliItalianJamaicanJapaneseJordanianKenyanKiowaKoreanLaotianLatvianLebaneseLiberianLithuanianLumbeeLuxembourgerMacedonianMalaysianMalteseMarshalleseMenomineeMexicanMexican American IndianMongolianMoroccanNative HawaiianNavajoNepaleseNew ZealanderNicaraguanNigerianNorthern EuropeanNorwegianOkinawanOsageOttawaPaiutePakistaniPalestinianPanamanianParaguayanPennsylvania GermanPeruvianPimaPolishPortuguesePotawatomiPuebloPuerto RicanPuget Sound SalishRomanianRussianSalvadoranSamoanScandinavianScotch-IrishScottishSeminoleSenegaleseSerbianShoshoneSierra LeoneanSiouxSlavicSlovakSloveneSomaliSouth AfricanSouth AmericanSouth American IndianSoviet UnionSpaniardSpanishSpanish AmericanSpanish American IndianSri LankanSubsaharan AfricanSudaneseSwedishSwissSyrianTaiwaneseThaiTlingit-HaidaTohono O'OdhamTonganTrinidadian and TobagonianTsimshianTurkishU.S. Virgin IslanderUgandanUkrainianUruguayanUteVenezuelanVietnameseWelshWest IndianYakamaYaquiYugoslavianYumanYup'ikZimbabwean
Immigration
NonimmigrantsImmigrantsAfghanistanAfricaAlbaniaArgentinaArmeniaAsiaAustraliaAustriaBahamasBangladeshBarbadosBelarusBelgiumBelizeBoliviaBosnia and HerzegovinaBrazilBulgariaBurma/MyanmarCabo VerdeCambodiaCameroonCanadaCaribbeanCentral AmericaChileChinaColombiaCongoCosta RicaCroatiaCubaCzechoslovakiaDenmarkDominicaDominican RepublicEastern AfricaEastern AsiaEastern EuropeEcuadorEgyptEl SalvadorEnglandEritreaEthiopiaEuropeFijiFranceGermanyGhanaGreeceGrenadaGuatemalaGuyanaHaitiHondurasHong KongHungaryIndiaIndonesiaIranIraqIrelandIsraelItalyJamaicaJapanJordanKazakhstanKenyaKoreaKuwaitLaosLatin AmericaLatviaLebanonLiberiaLithuaniaMalaysiaMexicoMicronesiaMiddle AfricaMoldovaMoroccoNepalNetherlandsNicaraguaNigeriaNorth AmericaNorth MacedoniaNorthern AfricaNorthern EuropeNorwayOceaniaPakistanPanamaPeruPhilippinesPolandPortugalRomaniaRussiaSaudi ArabiaScotlandSenegalSerbiaSierra LeoneSingaporeSomaliaSouth AfricaSouth AmericaSouth Central AsiaSouth Eastern AsiaSouthern EuropeSpainSri LankaSt. Vincent and the GrenadinesSudanSwedenSwitzerlandSyriaTaiwanThailandTrinidad and TobagoTurkeyUgandaUkraineUruguayUzbekistanVenezuelaVietnamWest IndiesWestern AfricaWestern AsiaWestern EuropeYemenZaireZimbabweAzores
Disability
Income
Poverty
Unemployment
Labor Participation
Family Structure
Vehicle Availability
Education Level
Disability

Disability Comparison

Cherokee

Immigrants from India

Tragic
Exceptional
14.8%
DISABILITY
0.0/ 100
METRIC RATING
336th/ 347
METRIC RANK
9.5%
DISABILITY
100.0/ 100
METRIC RATING
1st/ 347
METRIC RANK

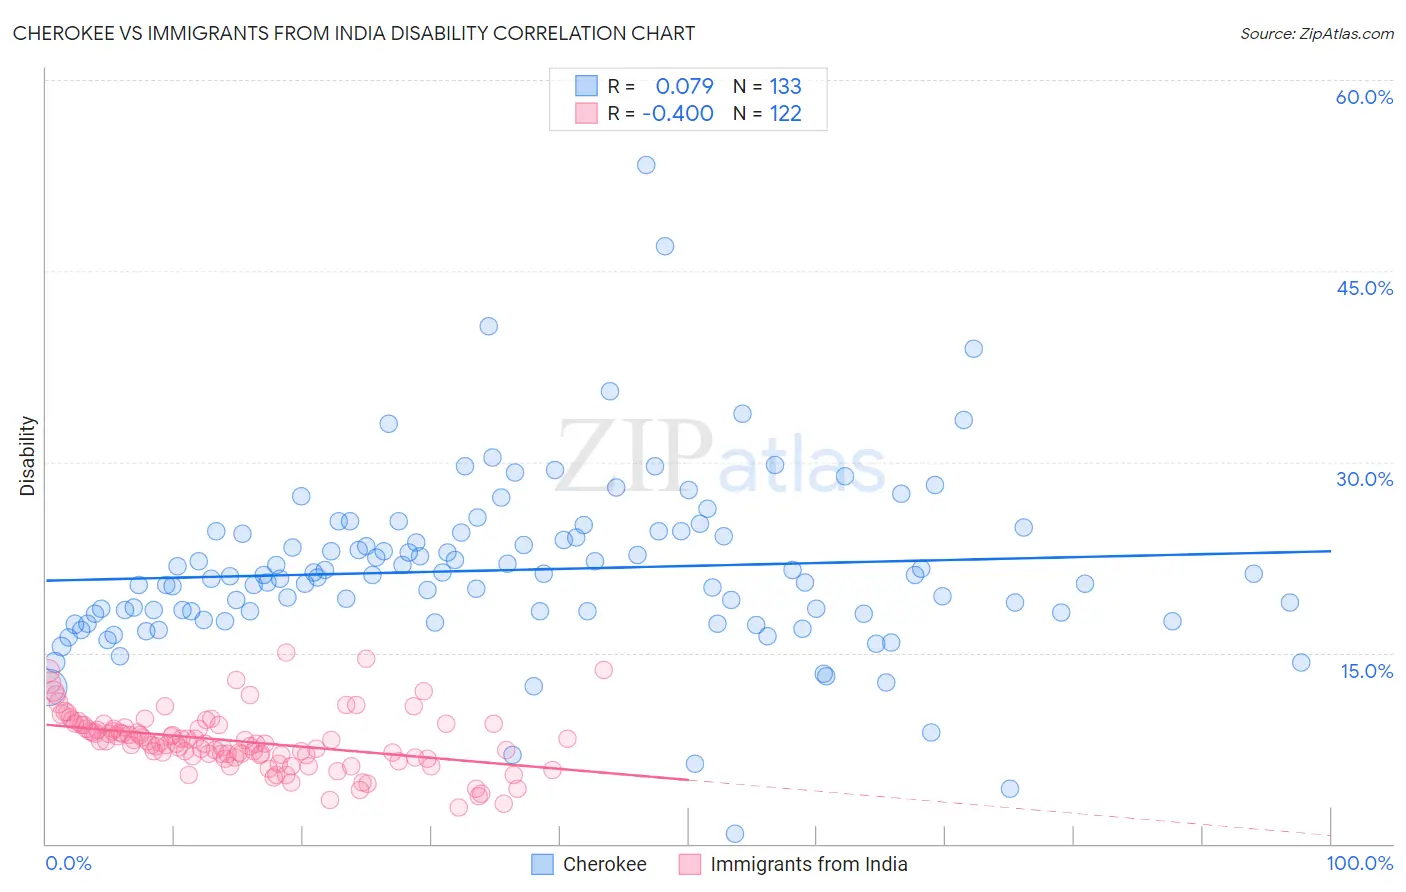
Cherokee vs Immigrants from India Disability Correlation Chart

The statistical analysis conducted on geographies consisting of 493,590,600 people shows a slight positive correlation between the proportion of Cherokee and percentage of population with a disability in the United States with a correlation coefficient (R) of 0.079 and weighted average of 14.8%. Similarly, the statistical analysis conducted on geographies consisting of 434,094,669 people shows a mild negative correlation between the proportion of Immigrants from India and percentage of population with a disability in the United States with a correlation coefficient (R) of -0.400 and weighted average of 9.5%, a difference of 56.2%.
Cherokee vs Immigrants from India Disability

Disability Correlation Summary

MeasurementCherokeeImmigrants from India
Minimum0.80%2.8%
Maximum53.3%15.1%
Range52.5%12.2%
Mean21.5%8.1%
Median21.0%7.9%
Interquartile 25% (IQ1)18.0%6.9%
Interquartile 75% (IQ3)24.4%9.3%
Interquartile Range (IQR)6.4%2.4%
Standard Deviation (Sample)6.9%2.3%
Standard Deviation (Population)6.9%2.3%

Similar Demographics by Disability

Demographics Similar to Cherokee by Disability

In terms of disability, the demographic groups most similar to Cherokee are Seminole (14.9%, a difference of 0.090%), Dutch West Indian (14.9%, a difference of 0.39%), Tohono O'odham (14.8%, a difference of 0.51%), Yuman (14.6%, a difference of 1.5%), and Cajun (14.6%, a difference of 1.7%).
DemographicsRating | RankDisability
Potawatomi
0.0
/100
|
#329
Tragic
14.2%
Navajo
0.0
/100
|
#330
Tragic
14.3%
Alaskan Athabascans
0.0
/100
|
#331
Tragic
14.4%
Pueblo
0.0
/100
|
#332
Tragic
14.4%
Cajuns
0.0
/100
|
#333
Tragic
14.6%
Yuman
0.0
/100
|
#334
Tragic
14.6%
Tohono O'odham
0.0
/100
|
#335
Tragic
14.8%
Cherokee
0.0
/100
|
#336
Tragic
14.8%
Seminole
0.0
/100
|
#337
Tragic
14.9%
Dutch West Indians
0.0
/100
|
#338
Tragic
14.9%
Chickasaw
0.0
/100
|
#339
Tragic
15.2%
Choctaw
0.0
/100
|
#340
Tragic
15.4%
Lumbee
0.0
/100
|
#341
Tragic
15.5%
Kiowa
0.0
/100
|
#342
Tragic
15.6%
Creek
0.0
/100
|
#343
Tragic
15.6%

Demographics Similar to Immigrants from India by Disability

In terms of disability, the demographic groups most similar to Immigrants from India are Filipino (9.6%, a difference of 0.98%), Immigrants from Taiwan (9.6%, a difference of 1.1%), Thai (9.7%, a difference of 2.1%), Immigrants from Bolivia (9.9%, a difference of 3.8%), and Immigrants from South Central Asia (9.9%, a difference of 4.7%).
DemographicsRating | RankDisability
Immigrants | India
100.0
/100
|
#1
Exceptional
9.5%
Filipinos
100.0
/100
|
#2
Exceptional
9.6%
Immigrants | Taiwan
100.0
/100
|
#3
Exceptional
9.6%
Thais
100.0
/100
|
#4
Exceptional
9.7%
Immigrants | Bolivia
100.0
/100
|
#5
Exceptional
9.9%
Immigrants | South Central Asia
100.0
/100
|
#6
Exceptional
9.9%
Immigrants | Singapore
100.0
/100
|
#7
Exceptional
10.0%
Bolivians
100.0
/100
|
#8
Exceptional
10.0%
Immigrants | Hong Kong
100.0
/100
|
#9
Exceptional
10.0%
Immigrants | China
100.0
/100
|
#10
Exceptional
10.1%
Iranians
100.0
/100
|
#11
Exceptional
10.1%
Immigrants | Israel
100.0
/100
|
#12
Exceptional
10.1%
Immigrants | Eastern Asia
100.0
/100
|
#13
Exceptional
10.2%
Immigrants | Korea
100.0
/100
|
#14
Exceptional
10.2%
Okinawans
100.0
/100
|
#15
Exceptional
10.3%