Immigrants from Uruguay vs Palestinian Disability
COMPARE
Immigrants from Uruguay
Palestinian
Disability
Disability Comparison
Immigrants from Uruguay
Palestinians
11.3%
DISABILITY
96.4/ 100
METRIC RATING
103rd/ 347
METRIC RANK
11.1%
DISABILITY
98.9/ 100
METRIC RATING
87th/ 347
METRIC RANK
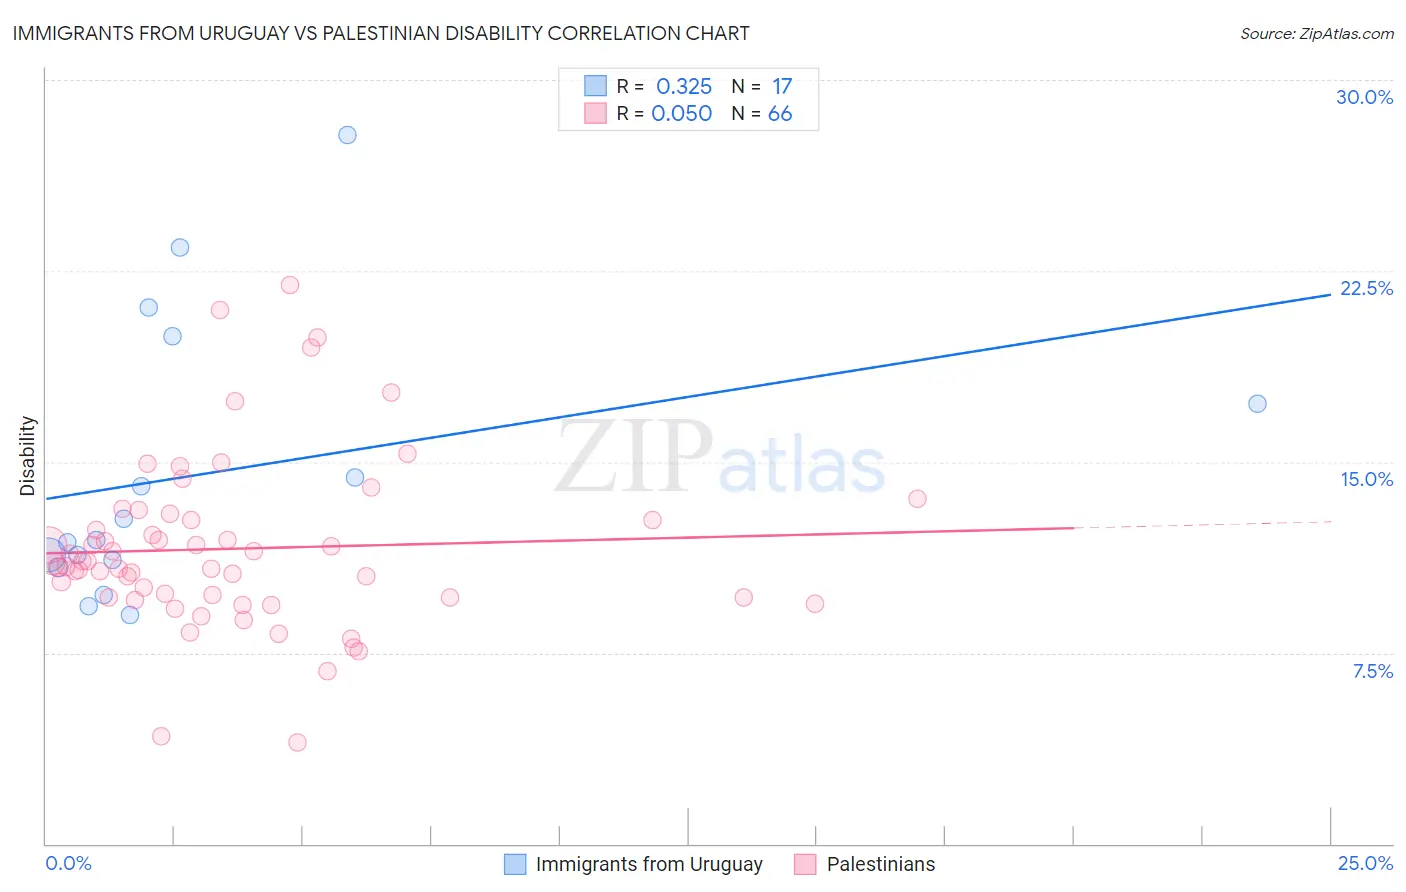
Immigrants from Uruguay vs Palestinian Disability Correlation Chart
The statistical analysis conducted on geographies consisting of 133,256,548 people shows a mild positive correlation between the proportion of Immigrants from Uruguay and percentage of population with a disability in the United States with a correlation coefficient (R) of 0.325 and weighted average of 11.3%. Similarly, the statistical analysis conducted on geographies consisting of 216,463,663 people shows no correlation between the proportion of Palestinians and percentage of population with a disability in the United States with a correlation coefficient (R) of 0.050 and weighted average of 11.1%, a difference of 1.3%.
Disability Correlation Summary
| Measurement | Immigrants from Uruguay | Palestinian |
| Minimum | 9.0% | 4.0% |
| Maximum | 27.9% | 21.9% |
| Range | 18.8% | 18.0% |
| Mean | 14.5% | 11.6% |
| Median | 12.0% | 11.0% |
| Interquartile 25% (IQ1) | 11.0% | 9.7% |
| Interquartile 75% (IQ3) | 18.6% | 12.7% |
| Interquartile Range (IQR) | 7.6% | 3.1% |
| Standard Deviation (Sample) | 5.5% | 3.4% |
| Standard Deviation (Population) | 5.3% | 3.4% |
Demographics Similar to Immigrants from Uruguay and Palestinians by Disability
In terms of disability, the demographic groups most similar to Immigrants from Uruguay are Immigrants (11.3%, a difference of 0.010%), Immigrants from Kazakhstan (11.3%, a difference of 0.020%), Immigrants from Eastern Africa (11.3%, a difference of 0.070%), Immigrants from Nicaragua (11.3%, a difference of 0.14%), and Immigrants from Greece (11.3%, a difference of 0.18%). Similarly, the demographic groups most similar to Palestinians are Immigrants from Belarus (11.1%, a difference of 0.040%), Immigrants from Russia (11.1%, a difference of 0.040%), Immigrants from Romania (11.2%, a difference of 0.29%), Immigrants from South Africa (11.2%, a difference of 0.54%), and Immigrants from Brazil (11.2%, a difference of 0.59%).
| Demographics | Rating | Rank | Disability |
| Immigrants | Belarus | 98.9 /100 | #85 | Exceptional 11.1% |
| Immigrants | Russia | 98.9 /100 | #86 | Exceptional 11.1% |
| Palestinians | 98.9 /100 | #87 | Exceptional 11.1% |
| Immigrants | Romania | 98.5 /100 | #88 | Exceptional 11.2% |
| Immigrants | South Africa | 98.2 /100 | #89 | Exceptional 11.2% |
| Immigrants | Brazil | 98.1 /100 | #90 | Exceptional 11.2% |
| Immigrants | Western Asia | 98.1 /100 | #91 | Exceptional 11.2% |
| Ecuadorians | 98.0 /100 | #92 | Exceptional 11.2% |
| Immigrants | Ecuador | 98.0 /100 | #93 | Exceptional 11.2% |
| Immigrants | Morocco | 97.8 /100 | #94 | Exceptional 11.2% |
| Eastern Europeans | 97.8 /100 | #95 | Exceptional 11.2% |
| Immigrants | Zimbabwe | 97.7 /100 | #96 | Exceptional 11.2% |
| Bhutanese | 97.4 /100 | #97 | Exceptional 11.2% |
| Uruguayans | 97.4 /100 | #98 | Exceptional 11.2% |
| Immigrants | Czechoslovakia | 97.4 /100 | #99 | Exceptional 11.2% |
| Immigrants | Greece | 96.9 /100 | #100 | Exceptional 11.3% |
| Immigrants | Nicaragua | 96.8 /100 | #101 | Exceptional 11.3% |
| Immigrants | Eastern Africa | 96.7 /100 | #102 | Exceptional 11.3% |
| Immigrants | Uruguay | 96.4 /100 | #103 | Exceptional 11.3% |
| Immigrants | Immigrants | 96.4 /100 | #104 | Exceptional 11.3% |
| Immigrants | Kazakhstan | 96.4 /100 | #105 | Exceptional 11.3% |