Immigrants from Taiwan vs Immigrants from Barbados Female Disability
COMPARE
Immigrants from Taiwan
Immigrants from Barbados
Female Disability
Female Disability Comparison
Immigrants from Taiwan
Immigrants from Barbados
10.1%
FEMALE DISABILITY
100.0/ 100
METRIC RATING
3rd/ 347
METRIC RANK
12.3%
FEMALE DISABILITY
21.1/ 100
METRIC RATING
203rd/ 347
METRIC RANK
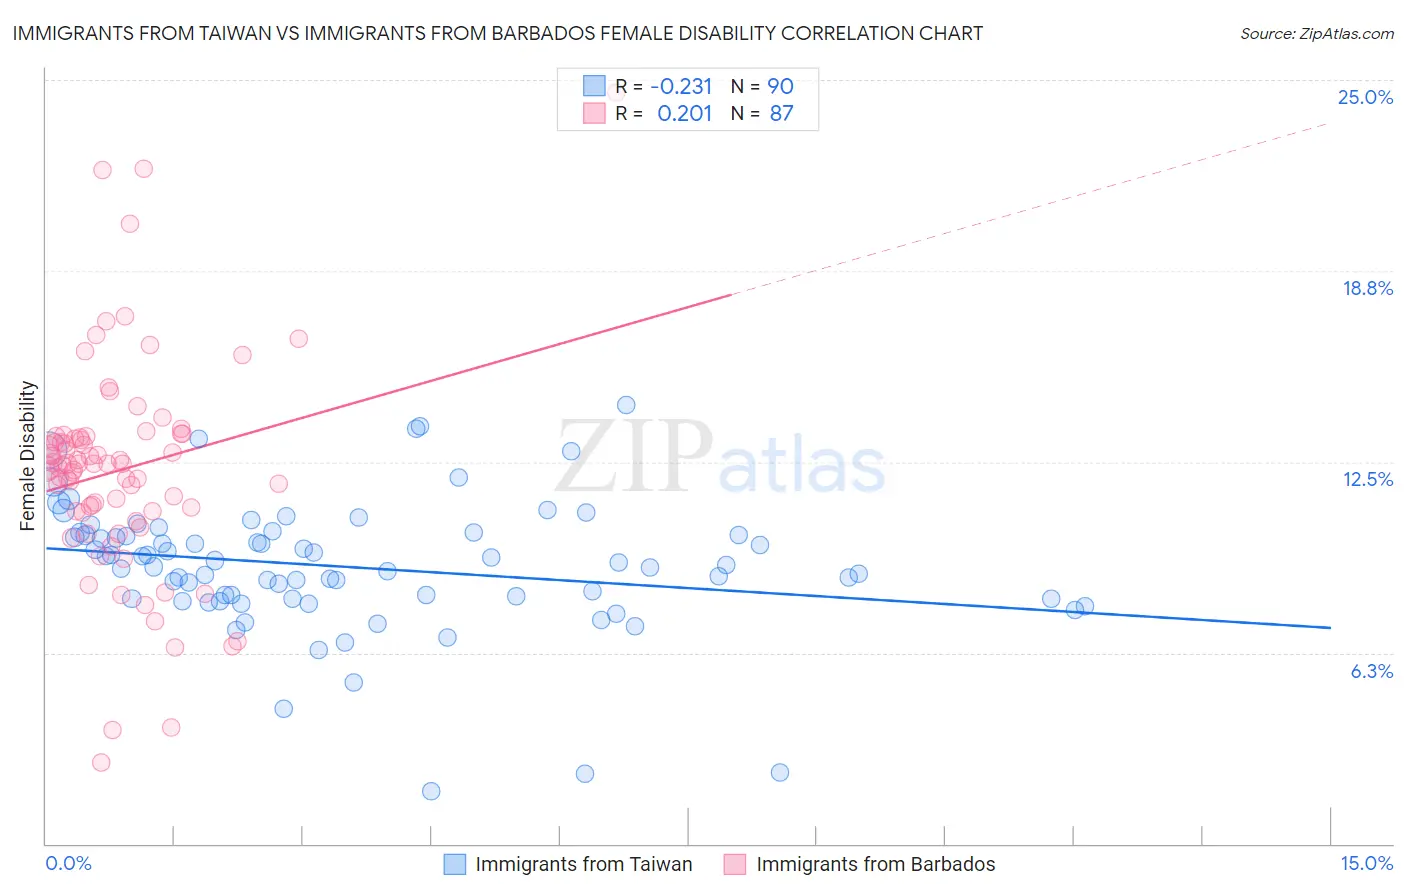
Immigrants from Taiwan vs Immigrants from Barbados Female Disability Correlation Chart
The statistical analysis conducted on geographies consisting of 298,238,185 people shows a weak negative correlation between the proportion of Immigrants from Taiwan and percentage of females with a disability in the United States with a correlation coefficient (R) of -0.231 and weighted average of 10.1%. Similarly, the statistical analysis conducted on geographies consisting of 112,784,400 people shows a weak positive correlation between the proportion of Immigrants from Barbados and percentage of females with a disability in the United States with a correlation coefficient (R) of 0.201 and weighted average of 12.3%, a difference of 22.4%.
Female Disability Correlation Summary
| Measurement | Immigrants from Taiwan | Immigrants from Barbados |
| Minimum | 1.7% | 2.7% |
| Maximum | 14.4% | 24.6% |
| Range | 12.7% | 21.9% |
| Mean | 9.1% | 12.2% |
| Median | 9.1% | 12.4% |
| Interquartile 25% (IQ1) | 8.0% | 10.9% |
| Interquartile 75% (IQ3) | 10.1% | 13.3% |
| Interquartile Range (IQR) | 2.1% | 2.4% |
| Standard Deviation (Sample) | 2.2% | 3.5% |
| Standard Deviation (Population) | 2.2% | 3.5% |
Similar Demographics by Female Disability
Demographics Similar to Immigrants from Taiwan by Female Disability
In terms of female disability, the demographic groups most similar to Immigrants from Taiwan are Filipino (10.1%, a difference of 0.23%), Thai (10.2%, a difference of 0.88%), Immigrants from India (10.0%, a difference of 1.2%), Immigrants from Bolivia (10.3%, a difference of 1.7%), and Bolivian (10.4%, a difference of 2.6%).
| Demographics | Rating | Rank | Female Disability |
| Immigrants | India | 100.0 /100 | #1 | Exceptional 10.0% |
| Filipinos | 100.0 /100 | #2 | Exceptional 10.1% |
| Immigrants | Taiwan | 100.0 /100 | #3 | Exceptional 10.1% |
| Thais | 100.0 /100 | #4 | Exceptional 10.2% |
| Immigrants | Bolivia | 100.0 /100 | #5 | Exceptional 10.3% |
| Bolivians | 100.0 /100 | #6 | Exceptional 10.4% |
| Immigrants | Singapore | 100.0 /100 | #7 | Exceptional 10.4% |
| Immigrants | South Central Asia | 100.0 /100 | #8 | Exceptional 10.5% |
| Iranians | 100.0 /100 | #9 | Exceptional 10.6% |
| Immigrants | Hong Kong | 100.0 /100 | #10 | Exceptional 10.6% |
| Immigrants | Korea | 100.0 /100 | #11 | Exceptional 10.6% |
| Immigrants | Israel | 100.0 /100 | #12 | Exceptional 10.7% |
| Immigrants | Eastern Asia | 100.0 /100 | #13 | Exceptional 10.7% |
| Immigrants | China | 100.0 /100 | #14 | Exceptional 10.7% |
| Burmese | 100.0 /100 | #15 | Exceptional 10.7% |
Demographics Similar to Immigrants from Barbados by Female Disability
In terms of female disability, the demographic groups most similar to Immigrants from Barbados are Somali (12.3%, a difference of 0.020%), Immigrants from Zaire (12.3%, a difference of 0.020%), Immigrants from Grenada (12.4%, a difference of 0.040%), Chinese (12.3%, a difference of 0.050%), and Immigrants from Cuba (12.4%, a difference of 0.050%).
| Demographics | Rating | Rank | Female Disability |
| Immigrants | Panama | 25.5 /100 | #196 | Fair 12.3% |
| Hondurans | 25.4 /100 | #197 | Fair 12.3% |
| Mexican American Indians | 24.9 /100 | #198 | Fair 12.3% |
| Immigrants | Trinidad and Tobago | 24.7 /100 | #199 | Fair 12.3% |
| Trinidadians and Tobagonians | 22.4 /100 | #200 | Fair 12.3% |
| Chinese | 22.1 /100 | #201 | Fair 12.3% |
| Somalis | 21.5 /100 | #202 | Fair 12.3% |
| Immigrants | Barbados | 21.1 /100 | #203 | Fair 12.3% |
| Immigrants | Zaire | 20.9 /100 | #204 | Fair 12.3% |
| Immigrants | Grenada | 20.5 /100 | #205 | Fair 12.4% |
| Immigrants | Cuba | 20.2 /100 | #206 | Fair 12.4% |
| Croatians | 20.2 /100 | #207 | Fair 12.4% |
| Basques | 17.5 /100 | #208 | Poor 12.4% |
| Mexicans | 15.7 /100 | #209 | Poor 12.4% |
| Swiss | 14.9 /100 | #210 | Poor 12.4% |