Immigrants from Sudan vs Crow Disability
COMPARE
Immigrants from Sudan
Crow
Disability
Disability Comparison
Immigrants from Sudan
Crow
11.5%
DISABILITY
85.3/ 100
METRIC RATING
142nd/ 347
METRIC RANK
12.9%
DISABILITY
0.0/ 100
METRIC RATING
285th/ 347
METRIC RANK
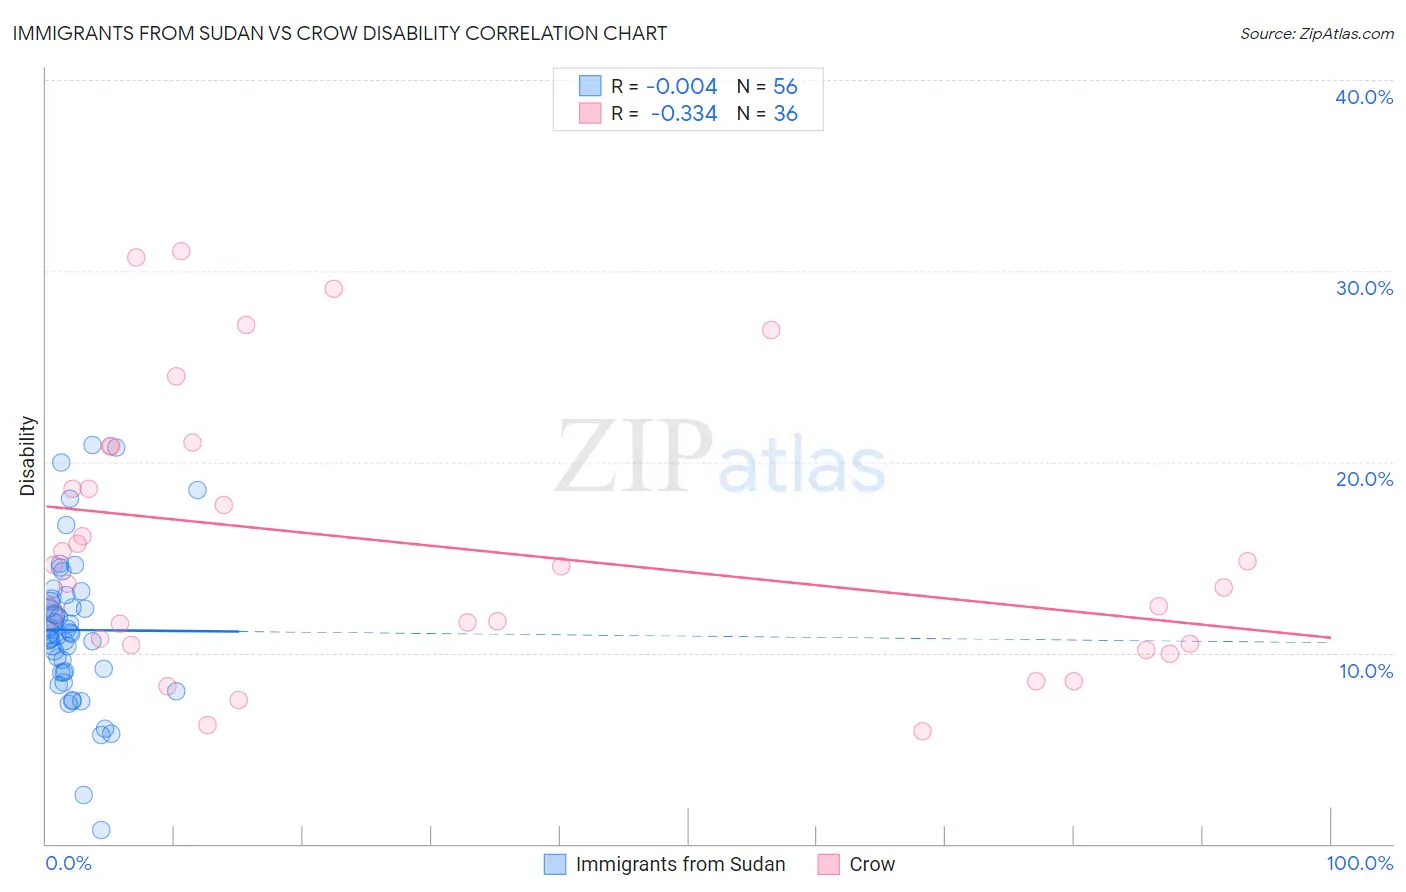
Immigrants from Sudan vs Crow Disability Correlation Chart
The statistical analysis conducted on geographies consisting of 118,962,854 people shows no correlation between the proportion of Immigrants from Sudan and percentage of population with a disability in the United States with a correlation coefficient (R) of -0.004 and weighted average of 11.5%. Similarly, the statistical analysis conducted on geographies consisting of 59,204,631 people shows a mild negative correlation between the proportion of Crow and percentage of population with a disability in the United States with a correlation coefficient (R) of -0.334 and weighted average of 12.9%, a difference of 12.5%.
Disability Correlation Summary
| Measurement | Immigrants from Sudan | Crow |
| Minimum | 0.75% | 5.9% |
| Maximum | 20.9% | 31.1% |
| Range | 20.1% | 25.1% |
| Mean | 11.2% | 15.6% |
| Median | 11.0% | 14.1% |
| Interquartile 25% (IQ1) | 9.0% | 10.4% |
| Interquartile 75% (IQ3) | 12.8% | 19.7% |
| Interquartile Range (IQR) | 3.8% | 9.3% |
| Standard Deviation (Sample) | 3.9% | 7.0% |
| Standard Deviation (Population) | 3.9% | 6.9% |
Similar Demographics by Disability
Demographics Similar to Immigrants from Sudan by Disability
In terms of disability, the demographic groups most similar to Immigrants from Sudan are Immigrants from Grenada (11.5%, a difference of 0.070%), Russian (11.5%, a difference of 0.14%), New Zealander (11.5%, a difference of 0.16%), Ghanaian (11.5%, a difference of 0.16%), and Kenyan (11.5%, a difference of 0.17%).
| Demographics | Rating | Rank | Disability |
| Ugandans | 87.9 /100 | #135 | Excellent 11.4% |
| Immigrants | St. Vincent and the Grenadines | 87.8 /100 | #136 | Excellent 11.4% |
| Kenyans | 87.1 /100 | #137 | Excellent 11.5% |
| New Zealanders | 87.0 /100 | #138 | Excellent 11.5% |
| Ghanaians | 87.0 /100 | #139 | Excellent 11.5% |
| Russians | 86.8 /100 | #140 | Excellent 11.5% |
| Immigrants | Grenada | 86.1 /100 | #141 | Excellent 11.5% |
| Immigrants | Sudan | 85.3 /100 | #142 | Excellent 11.5% |
| Moroccans | 83.3 /100 | #143 | Excellent 11.5% |
| Australians | 82.5 /100 | #144 | Excellent 11.5% |
| Nigerians | 81.3 /100 | #145 | Excellent 11.5% |
| Immigrants | Hungary | 79.0 /100 | #146 | Good 11.5% |
| Immigrants | Ukraine | 77.6 /100 | #147 | Good 11.5% |
| Sudanese | 77.1 /100 | #148 | Good 11.5% |
| Immigrants | Norway | 73.2 /100 | #149 | Good 11.6% |
Demographics Similar to Crow by Disability
In terms of disability, the demographic groups most similar to Crow are Welsh (12.9%, a difference of 0.010%), Irish (12.9%, a difference of 0.20%), Scottish (12.9%, a difference of 0.22%), Immigrants from Portugal (12.9%, a difference of 0.36%), and English (13.0%, a difference of 0.38%).
| Demographics | Rating | Rank | Disability |
| Germans | 0.0 /100 | #278 | Tragic 12.8% |
| Fijians | 0.0 /100 | #279 | Tragic 12.8% |
| Spanish | 0.0 /100 | #280 | Tragic 12.8% |
| Immigrants | Portugal | 0.0 /100 | #281 | Tragic 12.9% |
| Scottish | 0.0 /100 | #282 | Tragic 12.9% |
| Irish | 0.0 /100 | #283 | Tragic 12.9% |
| Welsh | 0.0 /100 | #284 | Tragic 12.9% |
| Crow | 0.0 /100 | #285 | Tragic 12.9% |
| English | 0.0 /100 | #286 | Tragic 13.0% |
| Africans | 0.0 /100 | #287 | Tragic 13.0% |
| Whites/Caucasians | 0.0 /100 | #288 | Tragic 13.0% |
| Slovaks | 0.0 /100 | #289 | Tragic 13.0% |
| Cheyenne | 0.0 /100 | #290 | Tragic 13.0% |
| Yaqui | 0.0 /100 | #291 | Tragic 13.1% |
| Aleuts | 0.0 /100 | #292 | Tragic 13.1% |