Immigrants from Singapore vs Arab Ambulatory Disability
COMPARE
Immigrants from Singapore
Arab
Ambulatory Disability
Ambulatory Disability Comparison
Immigrants from Singapore
Arabs
5.0%
AMBULATORY DISABILITY
100.0/ 100
METRIC RATING
5th/ 347
METRIC RANK
5.9%
AMBULATORY DISABILITY
91.5/ 100
METRIC RATING
126th/ 347
METRIC RANK
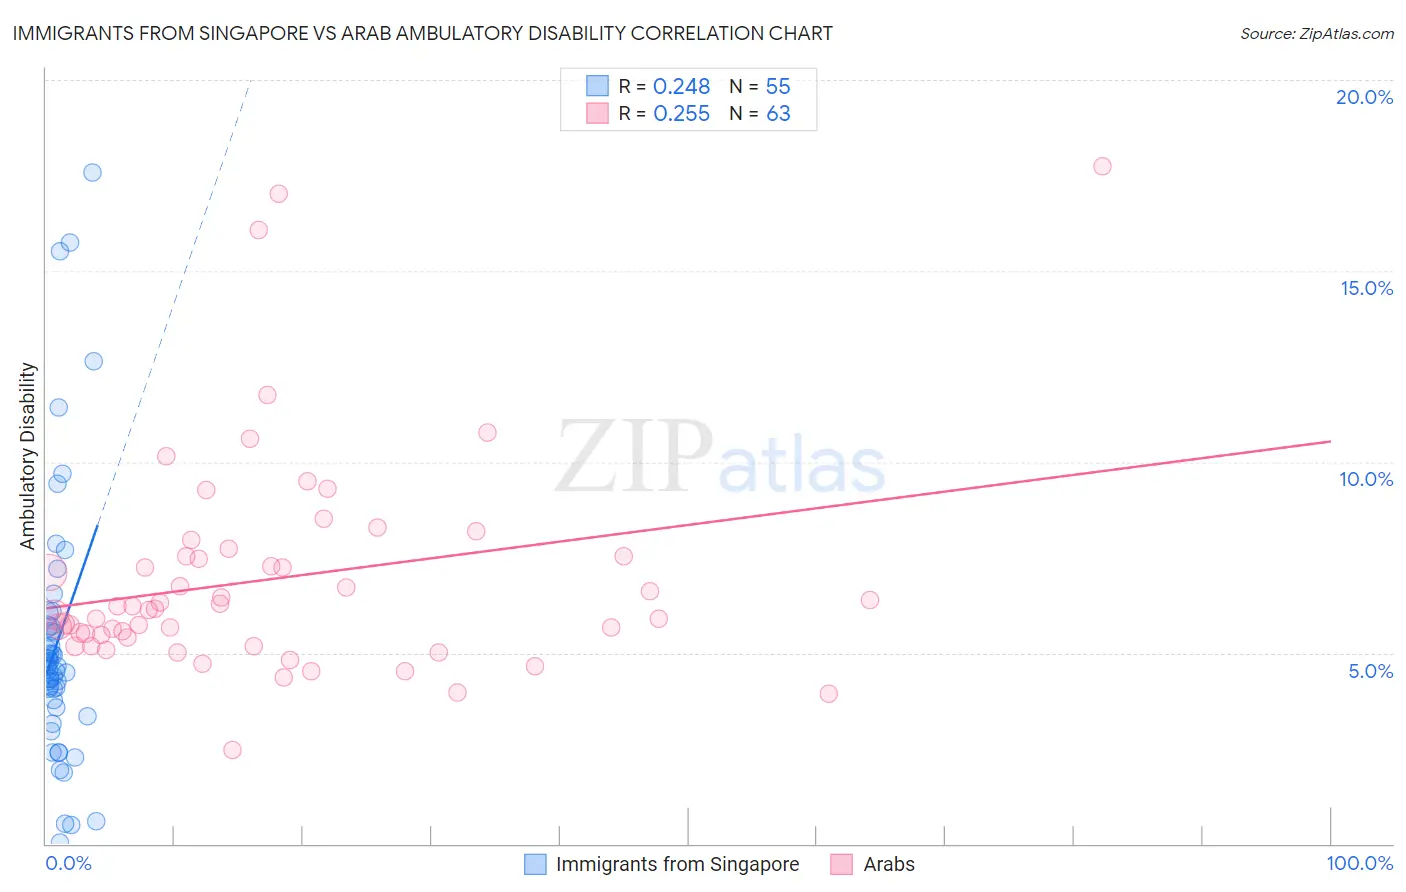
Immigrants from Singapore vs Arab Ambulatory Disability Correlation Chart
The statistical analysis conducted on geographies consisting of 137,492,636 people shows a weak positive correlation between the proportion of Immigrants from Singapore and percentage of population with ambulatory disability in the United States with a correlation coefficient (R) of 0.248 and weighted average of 5.0%. Similarly, the statistical analysis conducted on geographies consisting of 486,612,258 people shows a weak positive correlation between the proportion of Arabs and percentage of population with ambulatory disability in the United States with a correlation coefficient (R) of 0.255 and weighted average of 5.9%, a difference of 18.4%.
Ambulatory Disability Correlation Summary
| Measurement | Immigrants from Singapore | Arab |
| Minimum | 0.042% | 2.5% |
| Maximum | 17.6% | 17.8% |
| Range | 17.5% | 15.3% |
| Mean | 5.3% | 7.0% |
| Median | 4.6% | 6.2% |
| Interquartile 25% (IQ1) | 3.6% | 5.4% |
| Interquartile 75% (IQ3) | 5.7% | 7.5% |
| Interquartile Range (IQR) | 2.1% | 2.1% |
| Standard Deviation (Sample) | 3.6% | 2.9% |
| Standard Deviation (Population) | 3.6% | 2.8% |
Similar Demographics by Ambulatory Disability
Demographics Similar to Immigrants from Singapore by Ambulatory Disability
In terms of ambulatory disability, the demographic groups most similar to Immigrants from Singapore are Immigrants from Bolivia (5.0%, a difference of 0.68%), Bolivian (5.1%, a difference of 1.1%), Immigrants from Taiwan (4.9%, a difference of 1.4%), Thai (4.9%, a difference of 1.6%), and Immigrants from South Central Asia (5.1%, a difference of 2.1%).
| Demographics | Rating | Rank | Ambulatory Disability |
| Immigrants | India | 100.0 /100 | #1 | Exceptional 4.8% |
| Filipinos | 100.0 /100 | #2 | Exceptional 4.9% |
| Thais | 100.0 /100 | #3 | Exceptional 4.9% |
| Immigrants | Taiwan | 100.0 /100 | #4 | Exceptional 4.9% |
| Immigrants | Singapore | 100.0 /100 | #5 | Exceptional 5.0% |
| Immigrants | Bolivia | 100.0 /100 | #6 | Exceptional 5.0% |
| Bolivians | 100.0 /100 | #7 | Exceptional 5.1% |
| Immigrants | South Central Asia | 100.0 /100 | #8 | Exceptional 5.1% |
| Iranians | 100.0 /100 | #9 | Exceptional 5.1% |
| Yup'ik | 100.0 /100 | #10 | Exceptional 5.2% |
| Immigrants | Korea | 100.0 /100 | #11 | Exceptional 5.2% |
| Okinawans | 100.0 /100 | #12 | Exceptional 5.3% |
| Burmese | 100.0 /100 | #13 | Exceptional 5.3% |
| Immigrants | Eastern Asia | 100.0 /100 | #14 | Exceptional 5.3% |
| Immigrants | China | 100.0 /100 | #15 | Exceptional 5.3% |
Demographics Similar to Arabs by Ambulatory Disability
In terms of ambulatory disability, the demographic groups most similar to Arabs are Korean (5.9%, a difference of 0.020%), Immigrants from Nigeria (5.9%, a difference of 0.10%), Immigrants from Western Asia (5.9%, a difference of 0.13%), Immigrants from Middle Africa (5.9%, a difference of 0.14%), and Immigrants from Norway (5.9%, a difference of 0.17%).
| Demographics | Rating | Rank | Ambulatory Disability |
| Norwegians | 93.1 /100 | #119 | Exceptional 5.9% |
| Estonians | 92.9 /100 | #120 | Exceptional 5.9% |
| Costa Ricans | 92.6 /100 | #121 | Exceptional 5.9% |
| Icelanders | 92.6 /100 | #122 | Exceptional 5.9% |
| Immigrants | Russia | 92.4 /100 | #123 | Exceptional 5.9% |
| Immigrants | Middle Africa | 92.2 /100 | #124 | Exceptional 5.9% |
| Koreans | 91.6 /100 | #125 | Exceptional 5.9% |
| Arabs | 91.5 /100 | #126 | Exceptional 5.9% |
| Immigrants | Nigeria | 90.9 /100 | #127 | Exceptional 5.9% |
| Immigrants | Western Asia | 90.7 /100 | #128 | Exceptional 5.9% |
| Immigrants | Norway | 90.5 /100 | #129 | Exceptional 5.9% |
| Immigrants | Kazakhstan | 89.7 /100 | #130 | Excellent 5.9% |
| Immigrants | Costa Rica | 89.5 /100 | #131 | Excellent 5.9% |
| Immigrants | Europe | 87.8 /100 | #132 | Excellent 6.0% |
| Immigrants | Immigrants | 86.9 /100 | #133 | Excellent 6.0% |