Immigrants from Oceania vs Kenyan Self-Care Disability

COMPARE

Immigrants from Oceania
Race
Ancestry
AfghanAfricanAlaska NativeAlaskan AthabascanAlbanianAleutAlsatianAmericanApacheArabArapahoArgentineanArmenianAssyrian/Chaldean/SyriacAustralianAustrianBahamianBangladeshiBarbadianBasqueBelgianBelizeanBermudanBhutaneseBlackfeetBolivianBrazilianBritishBritish West IndianBulgarianBurmeseCajunCambodianCanadianCape VerdeanCarpatho RusynCelticCentral AmericanCentral American IndianCherokeeCheyenneChickasawChileanChineseChippewaChoctawColombianColvilleComancheCosta RicanCreeCreekCroatianCrowCubanCypriotCzechCzechoslovakianDanishDelawareDominicanDutchDutch West IndianEastern EuropeanEcuadorianEgyptianEnglishEstonianEthiopianEuropeanFijianFilipinoFinnishFrenchFrench American IndianFrench CanadianGermanGerman RussianGhanaianGreekGuamanian/ChamorroGuatemalanGuyaneseHaitianHmongHonduranHopiHoumaHungarianIcelanderIndian (Asian)IndonesianInupiatIranianIraqiIrishIroquoisIsraeliItalianJamaicanJapaneseJordanianKiowaKoreanLaotianLatvianLebaneseLiberianLithuanianLumbeeLuxembourgerMacedonianMalaysianMalteseMarshalleseMenomineeMexicanMexican American IndianMongolianMoroccanNative HawaiianNavajoNepaleseNew ZealanderNicaraguanNigerianNorthern EuropeanNorwegianOkinawanOsageOttawaPaiutePakistaniPalestinianPanamanianParaguayanPennsylvania GermanPeruvianPimaPolishPortuguesePotawatomiPuebloPuerto RicanPuget Sound SalishRomanianRussianSalvadoranSamoanScandinavianScotch-IrishScottishSeminoleSenegaleseSerbianShoshoneSierra LeoneanSiouxSlavicSlovakSloveneSomaliSouth AfricanSouth AmericanSouth American IndianSoviet UnionSpaniardSpanishSpanish AmericanSpanish American IndianSri LankanSubsaharan AfricanSudaneseSwedishSwissSyrianTaiwaneseThaiTlingit-HaidaTohono O'OdhamTonganTrinidadian and TobagonianTsimshianTurkishU.S. Virgin IslanderUgandanUkrainianUruguayanUteVenezuelanVietnameseWelshWest IndianYakamaYaquiYugoslavianYumanYup'ikZimbabwean
Immigration
NonimmigrantsImmigrantsAfghanistanAfricaAlbaniaArgentinaArmeniaAsiaAustraliaAustriaBahamasBangladeshBarbadosBelarusBelgiumBelizeBoliviaBosnia and HerzegovinaBrazilBulgariaBurma/MyanmarCabo VerdeCambodiaCameroonCanadaCaribbeanCentral AmericaChileChinaColombiaCongoCosta RicaCroatiaCubaCzechoslovakiaDenmarkDominicaDominican RepublicEastern AfricaEastern AsiaEastern EuropeEcuadorEgyptEl SalvadorEnglandEritreaEthiopiaEuropeFijiFranceGermanyGhanaGreeceGrenadaGuatemalaGuyanaHaitiHondurasHong KongHungaryIndiaIndonesiaIranIraqIrelandIsraelItalyJamaicaJapanJordanKazakhstanKenyaKoreaKuwaitLaosLatin AmericaLatviaLebanonLiberiaLithuaniaMalaysiaMexicoMicronesiaMiddle AfricaMoldovaMoroccoNepalNetherlandsNicaraguaNigeriaNorth AmericaNorth MacedoniaNorthern AfricaNorthern EuropeNorwayOceaniaPakistanPanamaPeruPhilippinesPolandPortugalRomaniaRussiaSaudi ArabiaScotlandSenegalSerbiaSierra LeoneSingaporeSomaliaSouth AfricaSouth AmericaSouth Central AsiaSouth Eastern AsiaSouthern EuropeSpainSri LankaSt. Vincent and the GrenadinesSudanSwedenSwitzerlandSyriaTaiwanThailandTrinidad and TobagoTurkeyUgandaUkraineUruguayUzbekistanVenezuelaVietnamWest IndiesWestern AfricaWestern AsiaWestern EuropeYemenZaireZimbabweAzores
Kenyan
Race
Ancestry
AfghanAfricanAlaska NativeAlaskan AthabascanAlbanianAleutAlsatianAmericanApacheArabArapahoArgentineanArmenianAssyrian/Chaldean/SyriacAustralianAustrianBahamianBangladeshiBarbadianBasqueBelgianBelizeanBermudanBhutaneseBlackfeetBolivianBrazilianBritishBritish West IndianBulgarianBurmeseCajunCambodianCanadianCape VerdeanCarpatho RusynCelticCentral AmericanCentral American IndianCherokeeCheyenneChickasawChileanChineseChippewaChoctawColombianColvilleComancheCosta RicanCreeCreekCroatianCrowCubanCypriotCzechCzechoslovakianDanishDelawareDominicanDutchDutch West IndianEastern EuropeanEcuadorianEgyptianEnglishEstonianEthiopianEuropeanFijianFilipinoFinnishFrenchFrench American IndianFrench CanadianGermanGerman RussianGhanaianGreekGuamanian/ChamorroGuatemalanGuyaneseHaitianHmongHonduranHopiHoumaHungarianIcelanderIndian (Asian)IndonesianInupiatIranianIraqiIrishIroquoisIsraeliItalianJamaicanJapaneseJordanianKenyanKiowaKoreanLaotianLatvianLebaneseLiberianLithuanianLumbeeLuxembourgerMacedonianMalaysianMalteseMarshalleseMenomineeMexicanMexican American IndianMongolianMoroccanNative HawaiianNavajoNepaleseNew ZealanderNicaraguanNigerianNorthern EuropeanNorwegianOkinawanOsageOttawaPaiutePakistaniPalestinianPanamanianParaguayanPennsylvania GermanPeruvianPimaPolishPortuguesePotawatomiPuebloPuerto RicanPuget Sound SalishRomanianRussianSalvadoranSamoanScandinavianScotch-IrishScottishSeminoleSenegaleseSerbianShoshoneSierra LeoneanSiouxSlavicSlovakSloveneSomaliSouth AfricanSouth AmericanSouth American IndianSoviet UnionSpaniardSpanishSpanish AmericanSpanish American IndianSri LankanSubsaharan AfricanSudaneseSwedishSwissSyrianTaiwaneseThaiTlingit-HaidaTohono O'OdhamTonganTrinidadian and TobagonianTsimshianTurkishU.S. Virgin IslanderUgandanUkrainianUruguayanUteVenezuelanVietnameseWelshWest IndianYakamaYaquiYugoslavianYumanYup'ikZimbabwean
Immigration
NonimmigrantsImmigrantsAfghanistanAfricaAlbaniaArgentinaArmeniaAsiaAustraliaAustriaBahamasBangladeshBarbadosBelarusBelgiumBelizeBoliviaBosnia and HerzegovinaBrazilBulgariaBurma/MyanmarCabo VerdeCambodiaCameroonCanadaCaribbeanCentral AmericaChileChinaColombiaCongoCosta RicaCroatiaCubaCzechoslovakiaDenmarkDominicaDominican RepublicEastern AfricaEastern AsiaEastern EuropeEcuadorEgyptEl SalvadorEnglandEritreaEthiopiaEuropeFijiFranceGermanyGhanaGreeceGrenadaGuatemalaGuyanaHaitiHondurasHong KongHungaryIndiaIndonesiaIranIraqIrelandIsraelItalyJamaicaJapanJordanKazakhstanKenyaKoreaKuwaitLaosLatin AmericaLatviaLebanonLiberiaLithuaniaMalaysiaMexicoMicronesiaMiddle AfricaMoldovaMoroccoNepalNetherlandsNicaraguaNigeriaNorth AmericaNorth MacedoniaNorthern AfricaNorthern EuropeNorwayPakistanPanamaPeruPhilippinesPolandPortugalRomaniaRussiaSaudi ArabiaScotlandSenegalSerbiaSierra LeoneSingaporeSomaliaSouth AfricaSouth AmericaSouth Central AsiaSouth Eastern AsiaSouthern EuropeSpainSri LankaSt. Vincent and the GrenadinesSudanSwedenSwitzerlandSyriaTaiwanThailandTrinidad and TobagoTurkeyUgandaUkraineUruguayUzbekistanVenezuelaVietnamWest IndiesWestern AfricaWestern AsiaWestern EuropeYemenZaireZimbabweAzores
Self-Care Disability
Income
Poverty
Unemployment
Labor Participation
Family Structure
Vehicle Availability
Education Level
Disability

Self-Care Disability Comparison

Immigrants from Oceania

Kenyans

Fair
Exceptional
2.5%
SELF-CARE DISABILITY
28.3/ 100
METRIC RATING
188th/ 347
METRIC RANK
2.3%
SELF-CARE DISABILITY
99.7/ 100
METRIC RATING
51st/ 347
METRIC RANK

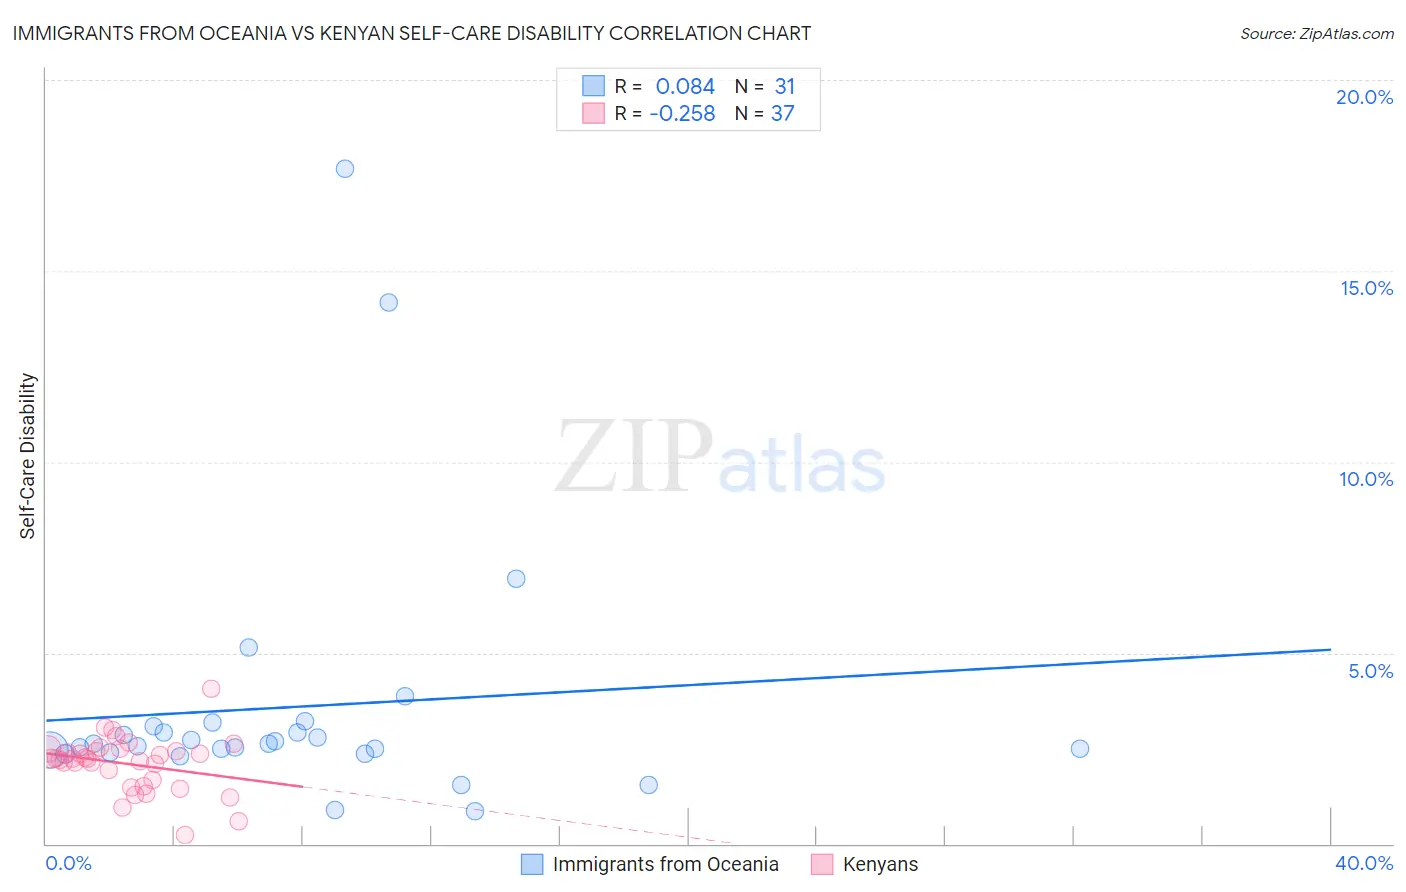
Immigrants from Oceania vs Kenyan Self-Care Disability Correlation Chart

The statistical analysis conducted on geographies consisting of 305,144,146 people shows a slight positive correlation between the proportion of Immigrants from Oceania and percentage of population with self-care disability in the United States with a correlation coefficient (R) of 0.084 and weighted average of 2.5%. Similarly, the statistical analysis conducted on geographies consisting of 168,082,411 people shows a weak negative correlation between the proportion of Kenyans and percentage of population with self-care disability in the United States with a correlation coefficient (R) of -0.258 and weighted average of 2.3%, a difference of 8.4%.
Immigrants from Oceania vs Kenyan Self-Care Disability

Self-Care Disability Correlation Summary

MeasurementImmigrants from OceaniaKenyan
Minimum0.86%0.23%
Maximum17.7%4.1%
Range16.8%3.8%
Mean3.6%2.1%
Median2.6%2.2%
Interquartile 25% (IQ1)2.4%1.6%
Interquartile 75% (IQ3)3.1%2.5%
Interquartile Range (IQR)0.68%0.87%
Standard Deviation (Sample)3.5%0.71%
Standard Deviation (Population)3.4%0.70%

Similar Demographics by Self-Care Disability

Demographics Similar to Immigrants from Oceania by Self-Care Disability

In terms of self-care disability, the demographic groups most similar to Immigrants from Oceania are Immigrants from Eastern Europe (2.5%, a difference of 0.010%), Irish (2.5%, a difference of 0.030%), Sioux (2.5%, a difference of 0.22%), Immigrants from El Salvador (2.5%, a difference of 0.26%), and Slavic (2.5%, a difference of 0.33%).
DemographicsRating | RankSelf-Care Disability
Ghanaians
40.4
/100
|
#181
Average
2.5%
Maltese
37.5
/100
|
#182
Fair
2.5%
Salvadorans
36.4
/100
|
#183
Fair
2.5%
Yugoslavians
36.1
/100
|
#184
Fair
2.5%
Slavs
34.3
/100
|
#185
Fair
2.5%
Immigrants | El Salvador
33.0
/100
|
#186
Fair
2.5%
Irish
28.7
/100
|
#187
Fair
2.5%
Immigrants | Oceania
28.3
/100
|
#188
Fair
2.5%
Immigrants | Eastern Europe
28.0
/100
|
#189
Fair
2.5%
Sioux
24.6
/100
|
#190
Fair
2.5%
Moroccans
22.9
/100
|
#191
Fair
2.5%
Soviet Union
22.2
/100
|
#192
Fair
2.5%
Ukrainians
21.4
/100
|
#193
Fair
2.5%
Immigrants | Germany
17.9
/100
|
#194
Poor
2.5%
Immigrants | Southern Europe
15.6
/100
|
#195
Poor
2.5%

Demographics Similar to Kenyans by Self-Care Disability

In terms of self-care disability, the demographic groups most similar to Kenyans are Immigrants from Serbia (2.3%, a difference of 0.020%), Australian (2.3%, a difference of 0.060%), Argentinean (2.3%, a difference of 0.10%), Immigrants from Brazil (2.3%, a difference of 0.15%), and Latvian (2.3%, a difference of 0.17%).
DemographicsRating | RankSelf-Care Disability
Immigrants | South Africa
99.8
/100
|
#44
Exceptional
2.3%
Norwegians
99.8
/100
|
#45
Exceptional
2.3%
Czechs
99.8
/100
|
#46
Exceptional
2.3%
Jordanians
99.7
/100
|
#47
Exceptional
2.3%
Immigrants | Malaysia
99.7
/100
|
#48
Exceptional
2.3%
Latvians
99.7
/100
|
#49
Exceptional
2.3%
Immigrants | Brazil
99.7
/100
|
#50
Exceptional
2.3%
Kenyans
99.7
/100
|
#51
Exceptional
2.3%
Immigrants | Serbia
99.6
/100
|
#52
Exceptional
2.3%
Australians
99.6
/100
|
#53
Exceptional
2.3%
Argentineans
99.6
/100
|
#54
Exceptional
2.3%
Immigrants | France
99.6
/100
|
#55
Exceptional
2.3%
Immigrants | Eastern Asia
99.6
/100
|
#56
Exceptional
2.3%
Immigrants | Belgium
99.6
/100
|
#57
Exceptional
2.3%
Immigrants | Cameroon
99.6
/100
|
#58
Exceptional
2.3%