Immigrants from Netherlands vs South American Indian Disability
COMPARE
Immigrants from Netherlands
South American Indian
Disability
Disability Comparison
Immigrants from Netherlands
South American Indians
11.6%
DISABILITY
69.8/ 100
METRIC RATING
155th/ 347
METRIC RANK
11.4%
DISABILITY
92.2/ 100
METRIC RATING
124th/ 347
METRIC RANK
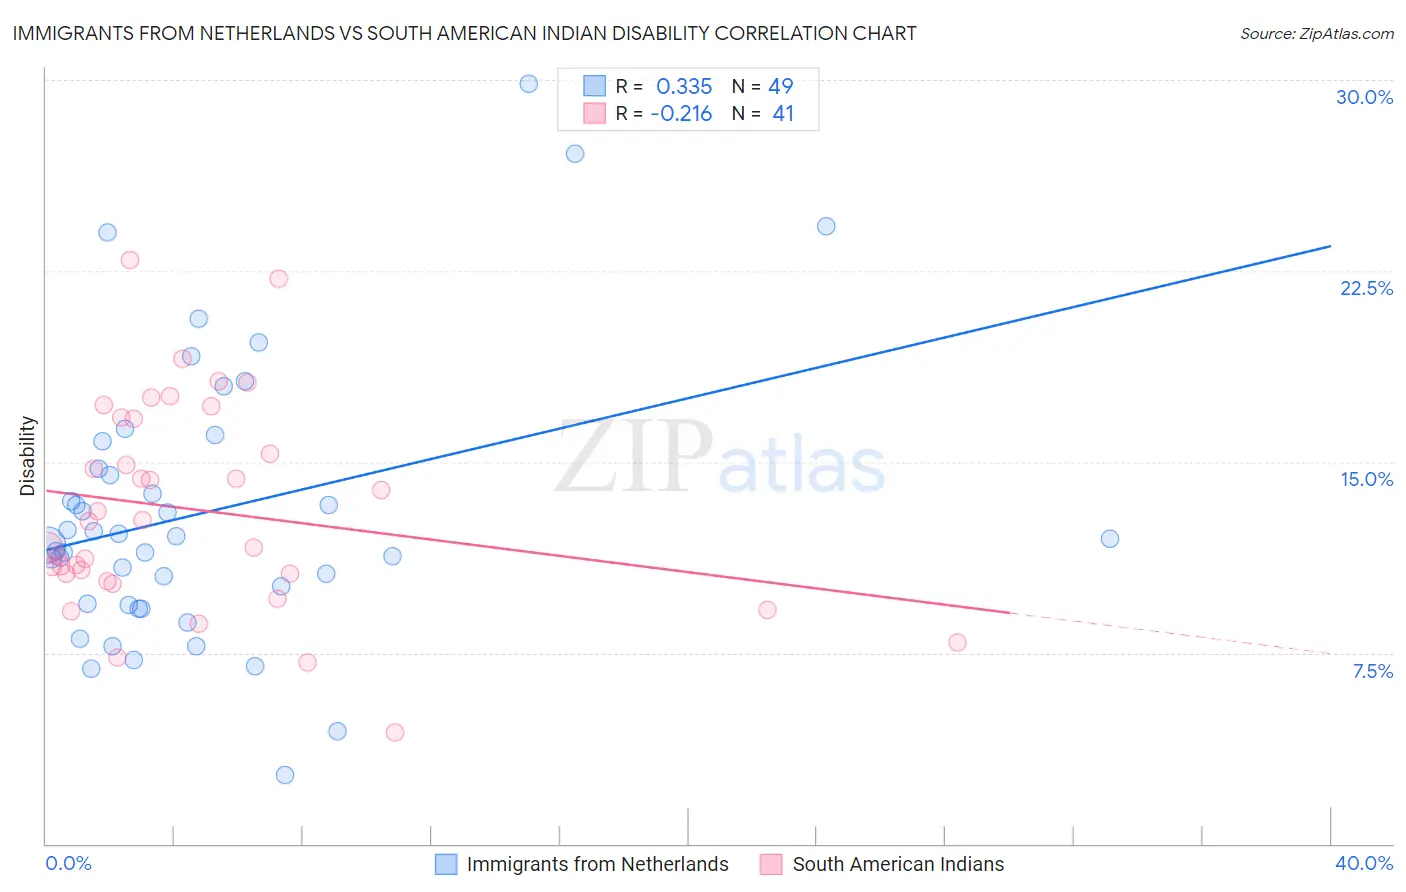
Immigrants from Netherlands vs South American Indian Disability Correlation Chart
The statistical analysis conducted on geographies consisting of 237,881,665 people shows a mild positive correlation between the proportion of Immigrants from Netherlands and percentage of population with a disability in the United States with a correlation coefficient (R) of 0.335 and weighted average of 11.6%. Similarly, the statistical analysis conducted on geographies consisting of 164,561,915 people shows a weak negative correlation between the proportion of South American Indians and percentage of population with a disability in the United States with a correlation coefficient (R) of -0.216 and weighted average of 11.4%, a difference of 1.9%.
Disability Correlation Summary
| Measurement | Immigrants from Netherlands | South American Indian |
| Minimum | 2.7% | 4.3% |
| Maximum | 29.8% | 22.9% |
| Range | 27.1% | 18.6% |
| Mean | 13.0% | 13.1% |
| Median | 12.0% | 12.7% |
| Interquartile 25% (IQ1) | 9.4% | 10.4% |
| Interquartile 75% (IQ3) | 15.3% | 16.7% |
| Interquartile Range (IQR) | 5.9% | 6.3% |
| Standard Deviation (Sample) | 5.5% | 4.1% |
| Standard Deviation (Population) | 5.4% | 4.1% |
Similar Demographics by Disability
Demographics Similar to Immigrants from Netherlands by Disability
In terms of disability, the demographic groups most similar to Immigrants from Netherlands are Immigrants from Fiji (11.6%, a difference of 0.010%), Immigrants from Middle Africa (11.6%, a difference of 0.020%), Immigrants from Guatemala (11.6%, a difference of 0.070%), Immigrants from Ghana (11.6%, a difference of 0.080%), and Immigrants from Moldova (11.6%, a difference of 0.12%).
| Demographics | Rating | Rank | Disability |
| Sudanese | 77.1 /100 | #148 | Good 11.5% |
| Immigrants | Norway | 73.2 /100 | #149 | Good 11.6% |
| Romanians | 72.7 /100 | #150 | Good 11.6% |
| Immigrants | Kenya | 72.1 /100 | #151 | Good 11.6% |
| Immigrants | Moldova | 72.0 /100 | #152 | Good 11.6% |
| Immigrants | Ghana | 71.2 /100 | #153 | Good 11.6% |
| Immigrants | Guatemala | 71.1 /100 | #154 | Good 11.6% |
| Immigrants | Netherlands | 69.8 /100 | #155 | Good 11.6% |
| Immigrants | Fiji | 69.5 /100 | #156 | Good 11.6% |
| Immigrants | Middle Africa | 69.5 /100 | #157 | Good 11.6% |
| Armenians | 65.9 /100 | #158 | Good 11.6% |
| Guatemalans | 65.1 /100 | #159 | Good 11.6% |
| Immigrants | Barbados | 64.2 /100 | #160 | Good 11.6% |
| Immigrants | Cuba | 62.8 /100 | #161 | Good 11.6% |
| Immigrants | Haiti | 59.2 /100 | #162 | Average 11.7% |
Demographics Similar to South American Indians by Disability
In terms of disability, the demographic groups most similar to South American Indians are South African (11.4%, a difference of 0.020%), Costa Rican (11.4%, a difference of 0.040%), Brazilian (11.4%, a difference of 0.19%), Immigrants from Latvia (11.4%, a difference of 0.19%), and Immigrants from North Macedonia (11.4%, a difference of 0.22%).
| Demographics | Rating | Rank | Disability |
| Luxembourgers | 93.9 /100 | #117 | Exceptional 11.3% |
| Koreans | 93.8 /100 | #118 | Exceptional 11.3% |
| Central Americans | 93.5 /100 | #119 | Exceptional 11.4% |
| Immigrants | North Macedonia | 93.5 /100 | #120 | Exceptional 11.4% |
| Immigrants | Costa Rica | 93.4 /100 | #121 | Exceptional 11.4% |
| Brazilians | 93.3 /100 | #122 | Exceptional 11.4% |
| South Africans | 92.3 /100 | #123 | Exceptional 11.4% |
| South American Indians | 92.2 /100 | #124 | Exceptional 11.4% |
| Costa Ricans | 91.9 /100 | #125 | Exceptional 11.4% |
| Immigrants | Latvia | 90.9 /100 | #126 | Exceptional 11.4% |
| Immigrants | Italy | 90.4 /100 | #127 | Exceptional 11.4% |
| Immigrants | Europe | 90.4 /100 | #128 | Exceptional 11.4% |
| Macedonians | 90.3 /100 | #129 | Exceptional 11.4% |
| Latvians | 89.8 /100 | #130 | Excellent 11.4% |
| Immigrants | Croatia | 89.8 /100 | #131 | Excellent 11.4% |