Brazilian vs South American Indian Disability
COMPARE
Brazilian
South American Indian
Disability
Disability Comparison
Brazilians
South American Indians
11.4%
DISABILITY
93.3/ 100
METRIC RATING
122nd/ 347
METRIC RANK
11.4%
DISABILITY
92.2/ 100
METRIC RATING
124th/ 347
METRIC RANK
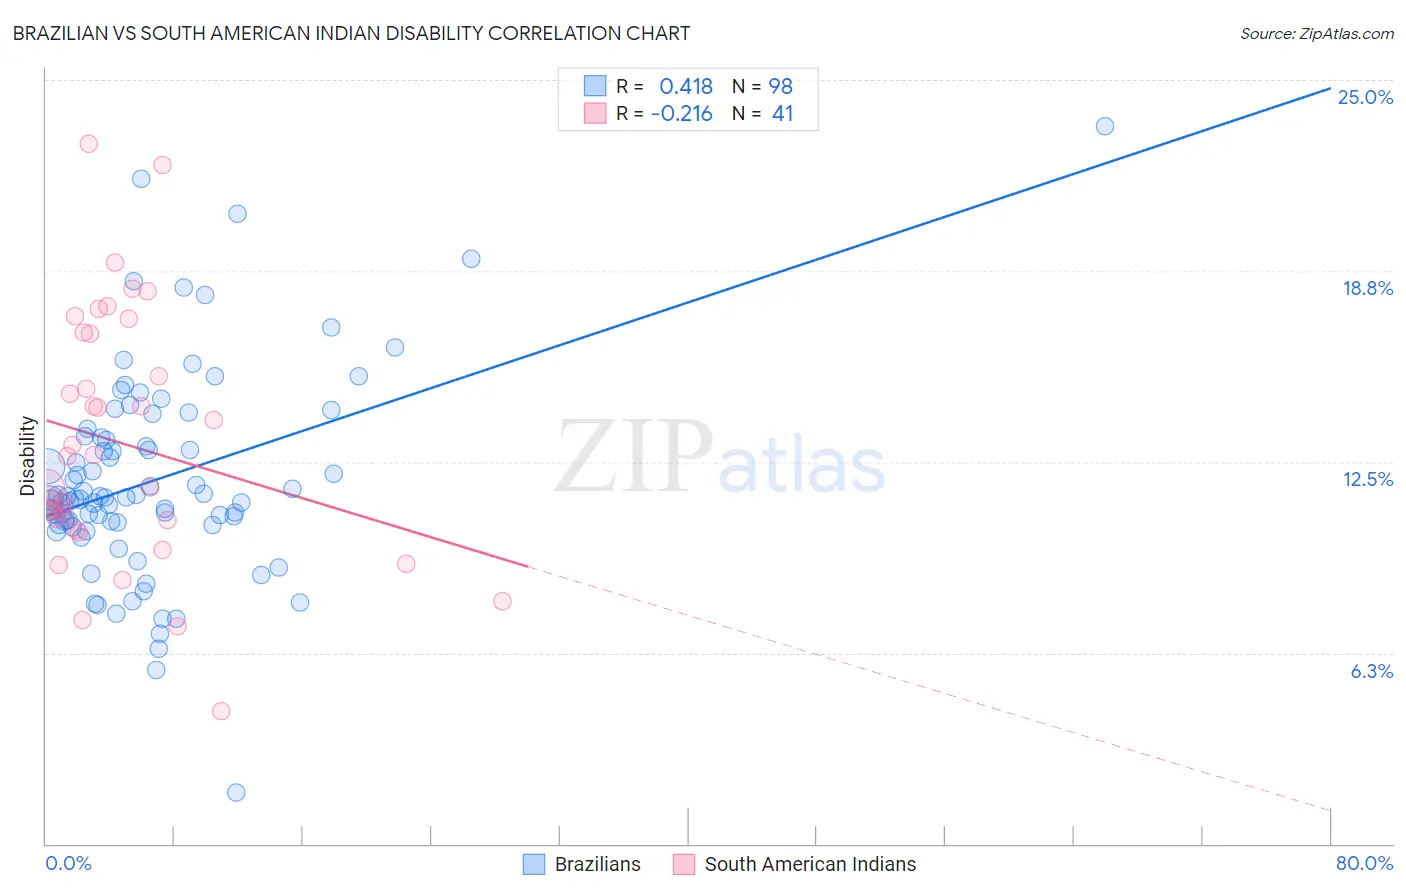
Brazilian vs South American Indian Disability Correlation Chart
The statistical analysis conducted on geographies consisting of 323,954,129 people shows a moderate positive correlation between the proportion of Brazilians and percentage of population with a disability in the United States with a correlation coefficient (R) of 0.418 and weighted average of 11.4%. Similarly, the statistical analysis conducted on geographies consisting of 164,561,915 people shows a weak negative correlation between the proportion of South American Indians and percentage of population with a disability in the United States with a correlation coefficient (R) of -0.216 and weighted average of 11.4%, a difference of 0.19%.
Disability Correlation Summary
| Measurement | Brazilian | South American Indian |
| Minimum | 1.7% | 4.3% |
| Maximum | 23.5% | 22.9% |
| Range | 21.8% | 18.6% |
| Mean | 11.9% | 13.1% |
| Median | 11.3% | 12.7% |
| Interquartile 25% (IQ1) | 10.5% | 10.4% |
| Interquartile 75% (IQ3) | 13.3% | 16.7% |
| Interquartile Range (IQR) | 2.8% | 6.3% |
| Standard Deviation (Sample) | 3.3% | 4.1% |
| Standard Deviation (Population) | 3.3% | 4.1% |
Demographics Similar to Brazilians and South American Indians by Disability
In terms of disability, the demographic groups most similar to Brazilians are Immigrants from Costa Rica (11.4%, a difference of 0.020%), Immigrants from North Macedonia (11.4%, a difference of 0.030%), Central American (11.4%, a difference of 0.040%), Korean (11.3%, a difference of 0.090%), and Luxembourger (11.3%, a difference of 0.10%). Similarly, the demographic groups most similar to South American Indians are South African (11.4%, a difference of 0.020%), Costa Rican (11.4%, a difference of 0.040%), Immigrants from Latvia (11.4%, a difference of 0.19%), Immigrants from North Macedonia (11.4%, a difference of 0.22%), and Immigrants from Costa Rica (11.4%, a difference of 0.22%).
| Demographics | Rating | Rank | Disability |
| Guyanese | 94.7 /100 | #113 | Exceptional 11.3% |
| Immigrants | Syria | 94.7 /100 | #114 | Exceptional 11.3% |
| Immigrants | Philippines | 94.6 /100 | #115 | Exceptional 11.3% |
| Immigrants | Northern Europe | 94.1 /100 | #116 | Exceptional 11.3% |
| Luxembourgers | 93.9 /100 | #117 | Exceptional 11.3% |
| Koreans | 93.8 /100 | #118 | Exceptional 11.3% |
| Central Americans | 93.5 /100 | #119 | Exceptional 11.4% |
| Immigrants | North Macedonia | 93.5 /100 | #120 | Exceptional 11.4% |
| Immigrants | Costa Rica | 93.4 /100 | #121 | Exceptional 11.4% |
| Brazilians | 93.3 /100 | #122 | Exceptional 11.4% |
| South Africans | 92.3 /100 | #123 | Exceptional 11.4% |
| South American Indians | 92.2 /100 | #124 | Exceptional 11.4% |
| Costa Ricans | 91.9 /100 | #125 | Exceptional 11.4% |
| Immigrants | Latvia | 90.9 /100 | #126 | Exceptional 11.4% |
| Immigrants | Italy | 90.4 /100 | #127 | Exceptional 11.4% |
| Immigrants | Europe | 90.4 /100 | #128 | Exceptional 11.4% |
| Macedonians | 90.3 /100 | #129 | Exceptional 11.4% |
| Latvians | 89.8 /100 | #130 | Excellent 11.4% |
| Immigrants | Croatia | 89.8 /100 | #131 | Excellent 11.4% |
| Immigrants | Africa | 89.3 /100 | #132 | Excellent 11.4% |
| Arabs | 89.1 /100 | #133 | Excellent 11.4% |