Immigrants from Middle Africa vs Immigrants from Bahamas Ambulatory Disability
COMPARE
Immigrants from Middle Africa
Immigrants from Bahamas
Ambulatory Disability
Ambulatory Disability Comparison
Immigrants from Middle Africa
Immigrants from Bahamas
5.9%
AMBULATORY DISABILITY
92.2/ 100
METRIC RATING
124th/ 347
METRIC RANK
6.5%
AMBULATORY DISABILITY
0.8/ 100
METRIC RATING
252nd/ 347
METRIC RANK
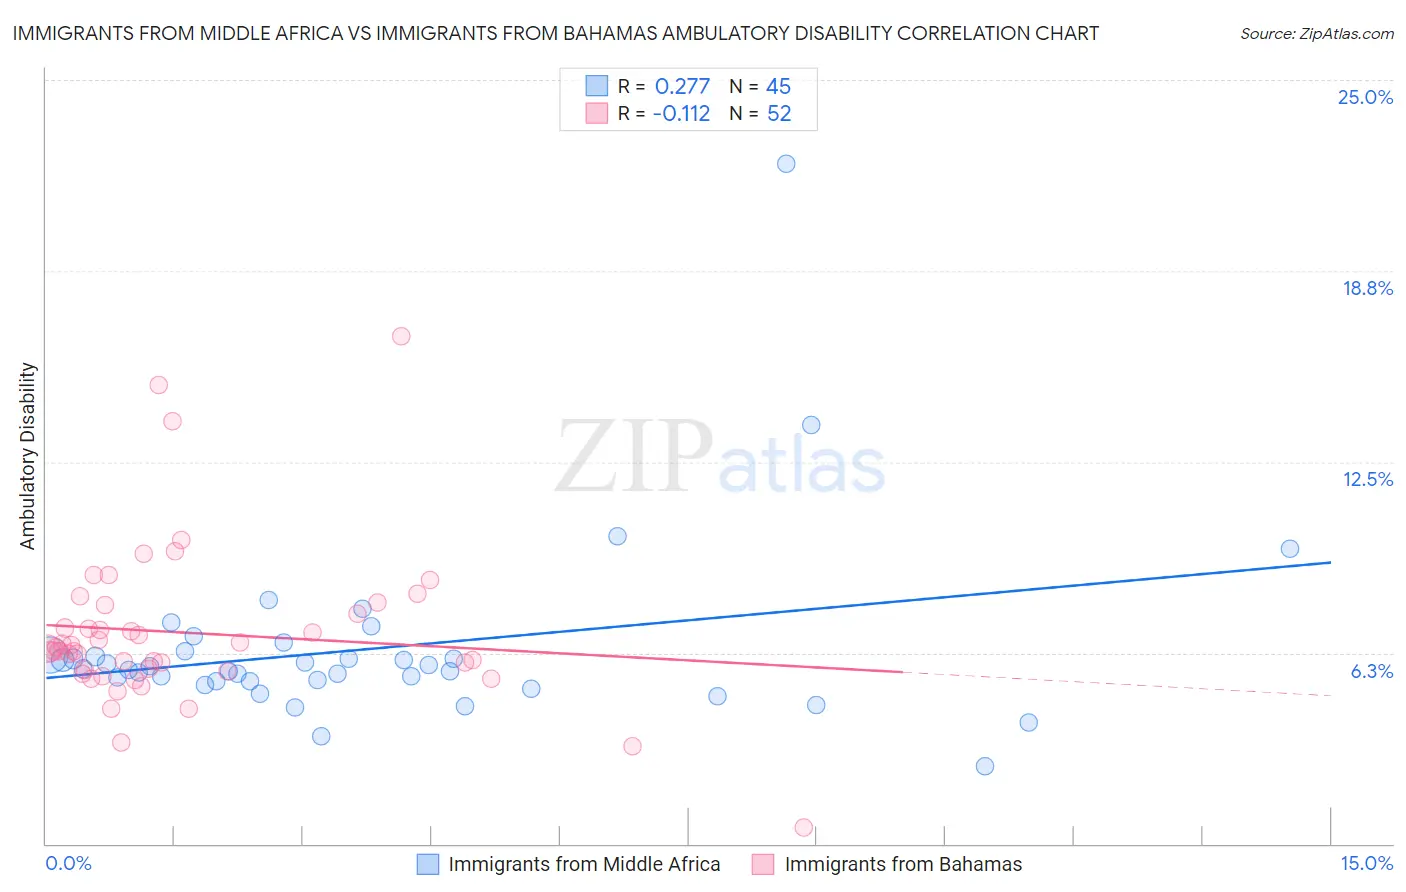
Immigrants from Middle Africa vs Immigrants from Bahamas Ambulatory Disability Correlation Chart
The statistical analysis conducted on geographies consisting of 202,691,189 people shows a weak positive correlation between the proportion of Immigrants from Middle Africa and percentage of population with ambulatory disability in the United States with a correlation coefficient (R) of 0.277 and weighted average of 5.9%. Similarly, the statistical analysis conducted on geographies consisting of 104,629,900 people shows a poor negative correlation between the proportion of Immigrants from Bahamas and percentage of population with ambulatory disability in the United States with a correlation coefficient (R) of -0.112 and weighted average of 6.5%, a difference of 10.0%.
Ambulatory Disability Correlation Summary
| Measurement | Immigrants from Middle Africa | Immigrants from Bahamas |
| Minimum | 2.5% | 0.55% |
| Maximum | 22.3% | 16.6% |
| Range | 19.7% | 16.1% |
| Mean | 6.4% | 6.9% |
| Median | 5.7% | 6.3% |
| Interquartile 25% (IQ1) | 5.3% | 5.7% |
| Interquartile 75% (IQ3) | 6.2% | 7.7% |
| Interquartile Range (IQR) | 0.93% | 2.0% |
| Standard Deviation (Sample) | 3.0% | 2.6% |
| Standard Deviation (Population) | 3.0% | 2.6% |
Similar Demographics by Ambulatory Disability
Demographics Similar to Immigrants from Middle Africa by Ambulatory Disability
In terms of ambulatory disability, the demographic groups most similar to Immigrants from Middle Africa are Immigrants from Russia (5.9%, a difference of 0.040%), Costa Rican (5.9%, a difference of 0.060%), Icelander (5.9%, a difference of 0.060%), Korean (5.9%, a difference of 0.12%), and Estonian (5.9%, a difference of 0.13%).
| Demographics | Rating | Rank | Ambulatory Disability |
| Immigrants | South Eastern Asia | 93.6 /100 | #117 | Exceptional 5.9% |
| Russians | 93.4 /100 | #118 | Exceptional 5.9% |
| Norwegians | 93.1 /100 | #119 | Exceptional 5.9% |
| Estonians | 92.9 /100 | #120 | Exceptional 5.9% |
| Costa Ricans | 92.6 /100 | #121 | Exceptional 5.9% |
| Icelanders | 92.6 /100 | #122 | Exceptional 5.9% |
| Immigrants | Russia | 92.4 /100 | #123 | Exceptional 5.9% |
| Immigrants | Middle Africa | 92.2 /100 | #124 | Exceptional 5.9% |
| Koreans | 91.6 /100 | #125 | Exceptional 5.9% |
| Arabs | 91.5 /100 | #126 | Exceptional 5.9% |
| Immigrants | Nigeria | 90.9 /100 | #127 | Exceptional 5.9% |
| Immigrants | Western Asia | 90.7 /100 | #128 | Exceptional 5.9% |
| Immigrants | Norway | 90.5 /100 | #129 | Exceptional 5.9% |
| Immigrants | Kazakhstan | 89.7 /100 | #130 | Excellent 5.9% |
| Immigrants | Costa Rica | 89.5 /100 | #131 | Excellent 5.9% |
Demographics Similar to Immigrants from Bahamas by Ambulatory Disability
In terms of ambulatory disability, the demographic groups most similar to Immigrants from Bahamas are Scottish (6.5%, a difference of 0.050%), Hawaiian (6.5%, a difference of 0.20%), Belizean (6.5%, a difference of 0.21%), Welsh (6.5%, a difference of 0.28%), and Immigrants from Uzbekistan (6.5%, a difference of 0.36%).
| Demographics | Rating | Rank | Ambulatory Disability |
| Tlingit-Haida | 1.5 /100 | #245 | Tragic 6.5% |
| Armenians | 1.5 /100 | #246 | Tragic 6.5% |
| Immigrants | Cuba | 1.4 /100 | #247 | Tragic 6.5% |
| Immigrants | Portugal | 1.4 /100 | #248 | Tragic 6.5% |
| Native Hawaiians | 1.1 /100 | #249 | Tragic 6.5% |
| Chinese | 1.0 /100 | #250 | Tragic 6.5% |
| Hawaiians | 0.9 /100 | #251 | Tragic 6.5% |
| Immigrants | Bahamas | 0.8 /100 | #252 | Tragic 6.5% |
| Scottish | 0.7 /100 | #253 | Tragic 6.5% |
| Belizeans | 0.7 /100 | #254 | Tragic 6.5% |
| Welsh | 0.6 /100 | #255 | Tragic 6.5% |
| Immigrants | Uzbekistan | 0.6 /100 | #256 | Tragic 6.5% |
| Bermudans | 0.5 /100 | #257 | Tragic 6.5% |
| Spanish American Indians | 0.5 /100 | #258 | Tragic 6.5% |
| Aleuts | 0.4 /100 | #259 | Tragic 6.6% |