Immigrants from Israel vs Immigrants from Egypt Disability
COMPARE
Immigrants from Israel
Immigrants from Egypt
Disability
Disability Comparison
Immigrants from Israel
Immigrants from Egypt
10.1%
DISABILITY
100.0/ 100
METRIC RATING
12th/ 347
METRIC RANK
10.6%
DISABILITY
100.0/ 100
METRIC RATING
31st/ 347
METRIC RANK
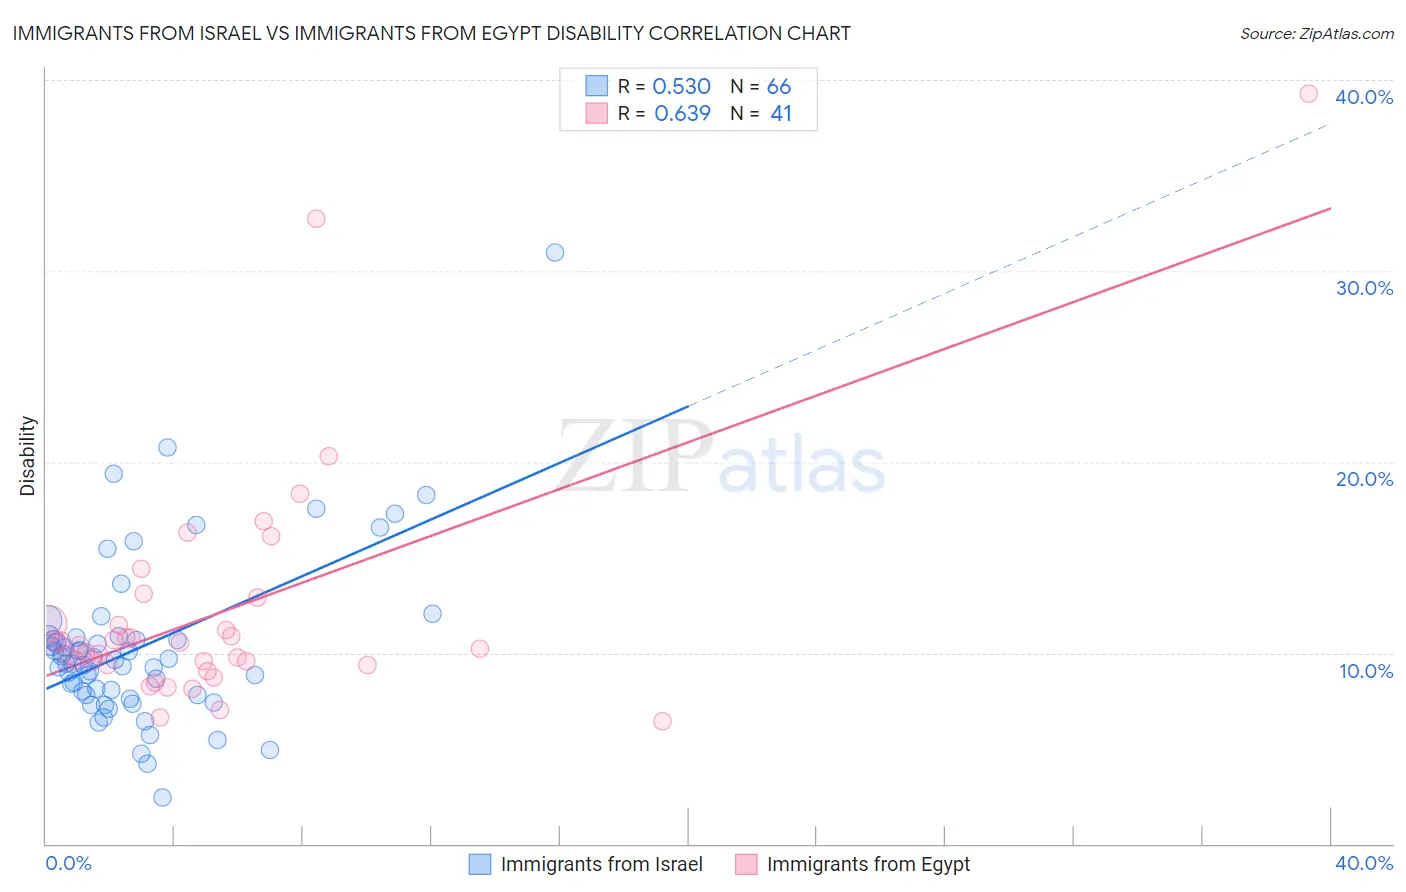
Immigrants from Israel vs Immigrants from Egypt Disability Correlation Chart
The statistical analysis conducted on geographies consisting of 210,034,302 people shows a substantial positive correlation between the proportion of Immigrants from Israel and percentage of population with a disability in the United States with a correlation coefficient (R) of 0.530 and weighted average of 10.1%. Similarly, the statistical analysis conducted on geographies consisting of 245,492,432 people shows a significant positive correlation between the proportion of Immigrants from Egypt and percentage of population with a disability in the United States with a correlation coefficient (R) of 0.639 and weighted average of 10.6%, a difference of 4.9%.
Disability Correlation Summary
| Measurement | Immigrants from Israel | Immigrants from Egypt |
| Minimum | 2.4% | 6.4% |
| Maximum | 31.0% | 39.3% |
| Range | 28.5% | 32.9% |
| Mean | 10.3% | 12.1% |
| Median | 9.5% | 10.4% |
| Interquartile 25% (IQ1) | 7.8% | 9.4% |
| Interquartile 75% (IQ3) | 10.8% | 12.2% |
| Interquartile Range (IQR) | 3.0% | 2.8% |
| Standard Deviation (Sample) | 4.5% | 6.3% |
| Standard Deviation (Population) | 4.4% | 6.2% |
Demographics Similar to Immigrants from Israel and Immigrants from Egypt by Disability
In terms of disability, the demographic groups most similar to Immigrants from Israel are Immigrants from Eastern Asia (10.2%, a difference of 0.21%), Iranian (10.1%, a difference of 0.25%), Immigrants from Korea (10.2%, a difference of 0.81%), Okinawan (10.3%, a difference of 1.1%), and Indian (Asian) (10.3%, a difference of 1.2%). Similarly, the demographic groups most similar to Immigrants from Egypt are Immigrants from Turkey (10.6%, a difference of 0.070%), Immigrants from Argentina (10.6%, a difference of 0.23%), Egyptian (10.6%, a difference of 0.35%), Cypriot (10.6%, a difference of 0.49%), and Argentinean (10.6%, a difference of 0.50%).
| Demographics | Rating | Rank | Disability |
| Iranians | 100.0 /100 | #11 | Exceptional 10.1% |
| Immigrants | Israel | 100.0 /100 | #12 | Exceptional 10.1% |
| Immigrants | Eastern Asia | 100.0 /100 | #13 | Exceptional 10.2% |
| Immigrants | Korea | 100.0 /100 | #14 | Exceptional 10.2% |
| Okinawans | 100.0 /100 | #15 | Exceptional 10.3% |
| Indians (Asian) | 100.0 /100 | #16 | Exceptional 10.3% |
| Immigrants | Iran | 100.0 /100 | #17 | Exceptional 10.3% |
| Burmese | 100.0 /100 | #18 | Exceptional 10.4% |
| Immigrants | Pakistan | 100.0 /100 | #19 | Exceptional 10.4% |
| Immigrants | Venezuela | 100.0 /100 | #20 | Exceptional 10.4% |
| Asians | 100.0 /100 | #21 | Exceptional 10.4% |
| Immigrants | Sri Lanka | 100.0 /100 | #22 | Exceptional 10.5% |
| Immigrants | Asia | 100.0 /100 | #23 | Exceptional 10.5% |
| Venezuelans | 100.0 /100 | #24 | Exceptional 10.5% |
| Immigrants | Malaysia | 100.0 /100 | #25 | Exceptional 10.6% |
| Argentineans | 100.0 /100 | #26 | Exceptional 10.6% |
| Cypriots | 100.0 /100 | #27 | Exceptional 10.6% |
| Egyptians | 100.0 /100 | #28 | Exceptional 10.6% |
| Immigrants | Argentina | 100.0 /100 | #29 | Exceptional 10.6% |
| Immigrants | Turkey | 100.0 /100 | #30 | Exceptional 10.6% |
| Immigrants | Egypt | 100.0 /100 | #31 | Exceptional 10.6% |