Immigrants from Hong Kong vs Alaskan Athabascan Cognitive Disability
COMPARE
Immigrants from Hong Kong
Alaskan Athabascan
Cognitive Disability
Cognitive Disability Comparison
Immigrants from Hong Kong
Alaskan Athabascans
16.0%
COGNITIVE DISABILITY
100.0/ 100
METRIC RATING
5th/ 347
METRIC RANK
17.6%
COGNITIVE DISABILITY
6.9/ 100
METRIC RATING
215th/ 347
METRIC RANK
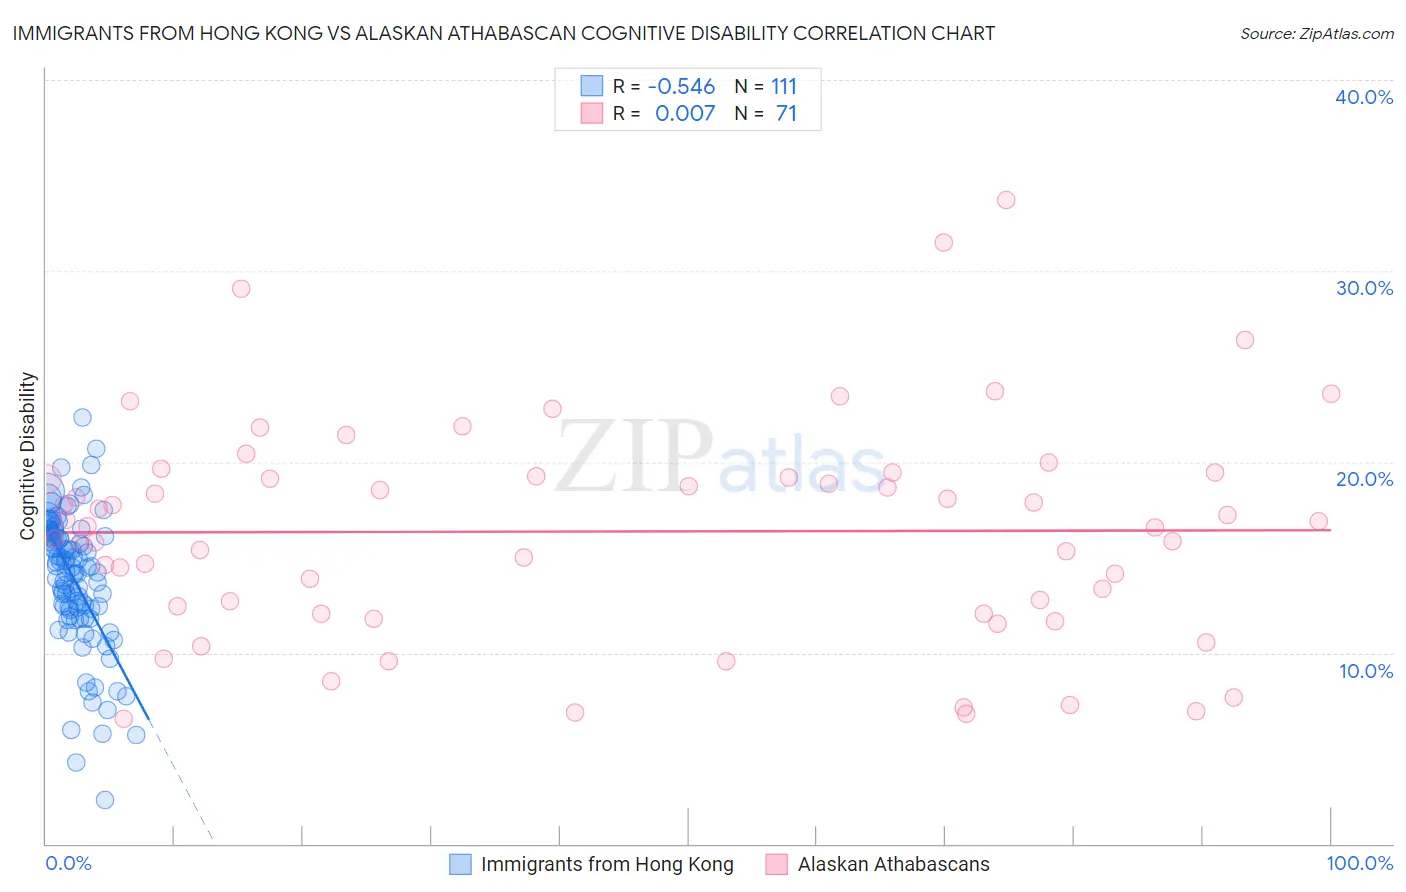
Immigrants from Hong Kong vs Alaskan Athabascan Cognitive Disability Correlation Chart
The statistical analysis conducted on geographies consisting of 253,985,578 people shows a substantial negative correlation between the proportion of Immigrants from Hong Kong and percentage of population with cognitive disability in the United States with a correlation coefficient (R) of -0.546 and weighted average of 16.0%. Similarly, the statistical analysis conducted on geographies consisting of 45,820,962 people shows no correlation between the proportion of Alaskan Athabascans and percentage of population with cognitive disability in the United States with a correlation coefficient (R) of 0.007 and weighted average of 17.6%, a difference of 9.8%.
Cognitive Disability Correlation Summary
| Measurement | Immigrants from Hong Kong | Alaskan Athabascan |
| Minimum | 2.3% | 6.5% |
| Maximum | 22.3% | 33.7% |
| Range | 20.0% | 27.2% |
| Mean | 13.8% | 16.4% |
| Median | 14.4% | 16.6% |
| Interquartile 25% (IQ1) | 12.2% | 12.1% |
| Interquartile 75% (IQ3) | 16.1% | 19.2% |
| Interquartile Range (IQR) | 3.9% | 7.2% |
| Standard Deviation (Sample) | 3.5% | 5.7% |
| Standard Deviation (Population) | 3.5% | 5.7% |
Similar Demographics by Cognitive Disability
Demographics Similar to Immigrants from Hong Kong by Cognitive Disability
In terms of cognitive disability, the demographic groups most similar to Immigrants from Hong Kong are Immigrants from Lithuania (16.0%, a difference of 0.41%), Chinese (15.9%, a difference of 0.59%), Thai (16.1%, a difference of 0.61%), Immigrants from India (15.9%, a difference of 0.68%), and Immigrants from Ireland (16.1%, a difference of 0.72%).
| Demographics | Rating | Rank | Cognitive Disability |
| Immigrants | Taiwan | 100.0 /100 | #1 | Exceptional 15.7% |
| Immigrants | India | 100.0 /100 | #2 | Exceptional 15.9% |
| Chinese | 100.0 /100 | #3 | Exceptional 15.9% |
| Immigrants | Lithuania | 100.0 /100 | #4 | Exceptional 16.0% |
| Immigrants | Hong Kong | 100.0 /100 | #5 | Exceptional 16.0% |
| Thais | 100.0 /100 | #6 | Exceptional 16.1% |
| Immigrants | Ireland | 100.0 /100 | #7 | Exceptional 16.1% |
| Immigrants | Poland | 100.0 /100 | #8 | Exceptional 16.1% |
| Assyrians/Chaldeans/Syriacs | 100.0 /100 | #9 | Exceptional 16.2% |
| Immigrants | Scotland | 100.0 /100 | #10 | Exceptional 16.2% |
| Immigrants | Czechoslovakia | 100.0 /100 | #11 | Exceptional 16.2% |
| Maltese | 100.0 /100 | #12 | Exceptional 16.2% |
| Lithuanians | 100.0 /100 | #13 | Exceptional 16.3% |
| Immigrants | Austria | 100.0 /100 | #14 | Exceptional 16.3% |
| Immigrants | Greece | 100.0 /100 | #15 | Exceptional 16.3% |
Demographics Similar to Alaskan Athabascans by Cognitive Disability
In terms of cognitive disability, the demographic groups most similar to Alaskan Athabascans are Immigrants from El Salvador (17.6%, a difference of 0.010%), Okinawan (17.6%, a difference of 0.010%), Salvadoran (17.6%, a difference of 0.020%), Hawaiian (17.6%, a difference of 0.030%), and Immigrants from Oceania (17.6%, a difference of 0.050%).
| Demographics | Rating | Rank | Cognitive Disability |
| Immigrants | Cameroon | 9.3 /100 | #208 | Tragic 17.6% |
| Immigrants | Trinidad and Tobago | 8.7 /100 | #209 | Tragic 17.6% |
| Immigrants | Jamaica | 8.5 /100 | #210 | Tragic 17.6% |
| Taiwanese | 7.7 /100 | #211 | Tragic 17.6% |
| Immigrants | Oceania | 7.3 /100 | #212 | Tragic 17.6% |
| Hawaiians | 7.2 /100 | #213 | Tragic 17.6% |
| Immigrants | El Salvador | 7.0 /100 | #214 | Tragic 17.6% |
| Alaskan Athabascans | 6.9 /100 | #215 | Tragic 17.6% |
| Okinawans | 6.8 /100 | #216 | Tragic 17.6% |
| Salvadorans | 6.7 /100 | #217 | Tragic 17.6% |
| Icelanders | 6.4 /100 | #218 | Tragic 17.6% |
| Immigrants | Sierra Leone | 6.3 /100 | #219 | Tragic 17.6% |
| Zimbabweans | 6.1 /100 | #220 | Tragic 17.6% |
| Moroccans | 5.9 /100 | #221 | Tragic 17.6% |
| Central Americans | 4.5 /100 | #222 | Tragic 17.7% |