Immigrants from Guyana vs Jamaican Disability Age Over 75
COMPARE
Immigrants from Guyana
Jamaican
Disability Age Over 75
Disability Age Over 75 Comparison
Immigrants from Guyana
Jamaicans
47.1%
DISABILITY AGE OVER 75
71.9/ 100
METRIC RATING
158th/ 347
METRIC RANK
47.7%
DISABILITY AGE OVER 75
19.0/ 100
METRIC RATING
206th/ 347
METRIC RANK
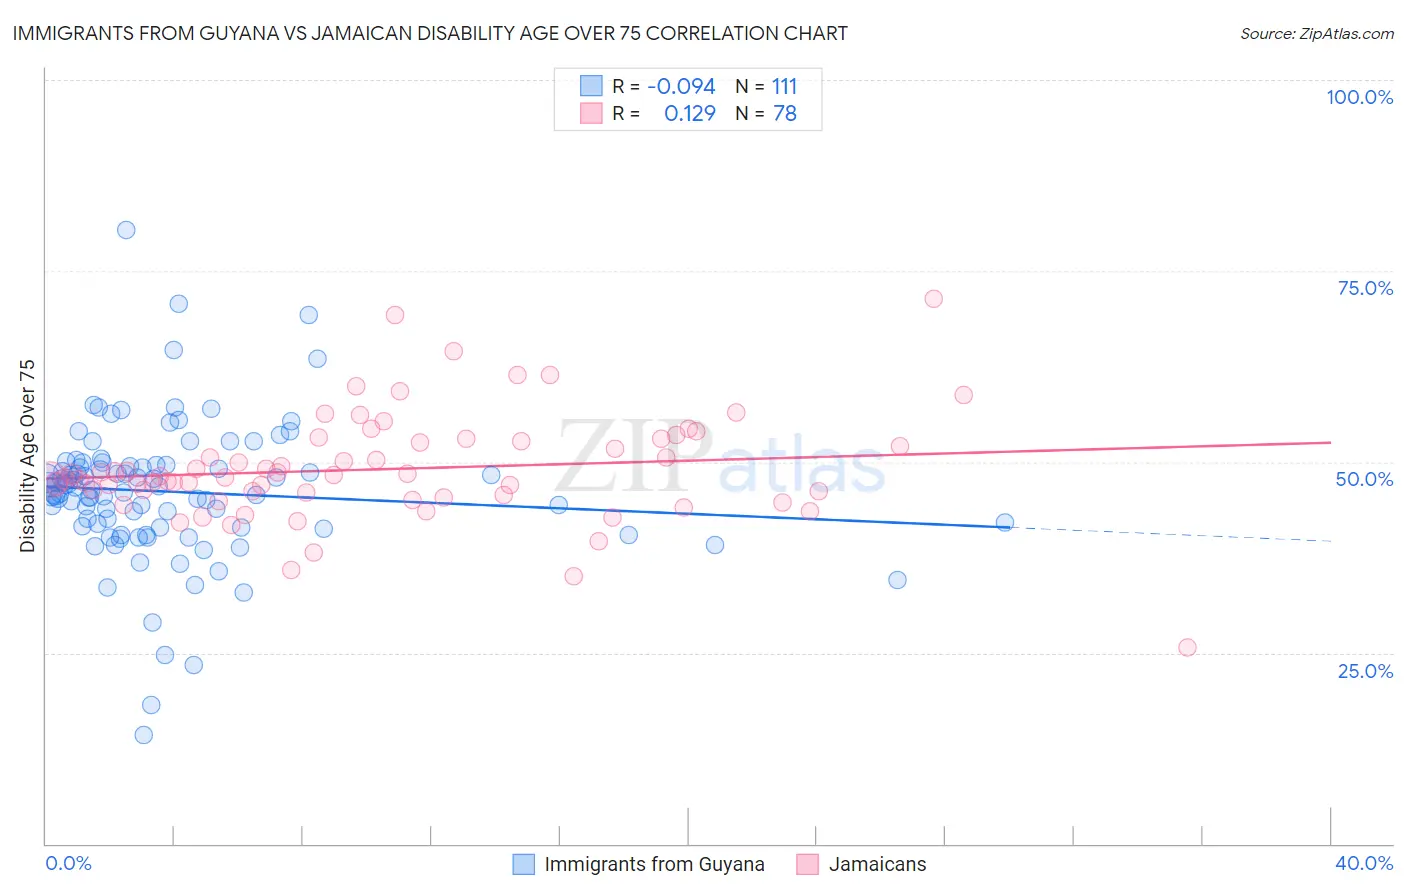
Immigrants from Guyana vs Jamaican Disability Age Over 75 Correlation Chart
The statistical analysis conducted on geographies consisting of 183,514,554 people shows a slight negative correlation between the proportion of Immigrants from Guyana and percentage of population with a disability over the age of 75 in the United States with a correlation coefficient (R) of -0.094 and weighted average of 47.1%. Similarly, the statistical analysis conducted on geographies consisting of 366,963,614 people shows a poor positive correlation between the proportion of Jamaicans and percentage of population with a disability over the age of 75 in the United States with a correlation coefficient (R) of 0.129 and weighted average of 47.7%, a difference of 1.3%.
Disability Age Over 75 Correlation Summary
| Measurement | Immigrants from Guyana | Jamaican |
| Minimum | 14.3% | 25.7% |
| Maximum | 80.4% | 71.4% |
| Range | 66.1% | 45.7% |
| Mean | 46.1% | 49.0% |
| Median | 46.7% | 48.1% |
| Interquartile 25% (IQ1) | 41.4% | 45.7% |
| Interquartile 75% (IQ3) | 49.5% | 52.8% |
| Interquartile Range (IQR) | 8.1% | 7.1% |
| Standard Deviation (Sample) | 9.1% | 7.0% |
| Standard Deviation (Population) | 9.1% | 7.0% |
Similar Demographics by Disability Age Over 75
Demographics Similar to Immigrants from Guyana by Disability Age Over 75
In terms of disability age over 75, the demographic groups most similar to Immigrants from Guyana are Immigrants from Morocco (47.1%, a difference of 0.010%), Bhutanese (47.1%, a difference of 0.020%), Arab (47.1%, a difference of 0.040%), Immigrants from Zaire (47.1%, a difference of 0.080%), and Immigrants from Belarus (47.1%, a difference of 0.080%).
| Demographics | Rating | Rank | Disability Age Over 75 |
| French Canadians | 79.0 /100 | #151 | Good 47.0% |
| Immigrants | Asia | 76.5 /100 | #152 | Good 47.0% |
| Immigrants | Zaire | 74.8 /100 | #153 | Good 47.1% |
| Immigrants | Belarus | 74.8 /100 | #154 | Good 47.1% |
| Immigrants | Iran | 74.7 /100 | #155 | Good 47.1% |
| Arabs | 73.3 /100 | #156 | Good 47.1% |
| Bhutanese | 72.6 /100 | #157 | Good 47.1% |
| Immigrants | Guyana | 71.9 /100 | #158 | Good 47.1% |
| Immigrants | Morocco | 71.4 /100 | #159 | Good 47.1% |
| Immigrants | Middle Africa | 68.3 /100 | #160 | Good 47.1% |
| South American Indians | 68.1 /100 | #161 | Good 47.1% |
| Pennsylvania Germans | 66.0 /100 | #162 | Good 47.2% |
| Immigrants | Eastern Africa | 65.5 /100 | #163 | Good 47.2% |
| French | 64.6 /100 | #164 | Good 47.2% |
| Immigrants | Zimbabwe | 64.4 /100 | #165 | Good 47.2% |
Demographics Similar to Jamaicans by Disability Age Over 75
In terms of disability age over 75, the demographic groups most similar to Jamaicans are Immigrants from Ghana (47.7%, a difference of 0.0%), Nigerian (47.7%, a difference of 0.010%), Trinidadian and Tobagonian (47.7%, a difference of 0.040%), Immigrants from Cuba (47.7%, a difference of 0.060%), and Immigrants from Bahamas (47.7%, a difference of 0.060%).
| Demographics | Rating | Rank | Disability Age Over 75 |
| Immigrants | Eritrea | 22.4 /100 | #199 | Fair 47.7% |
| Immigrants | Somalia | 21.4 /100 | #200 | Fair 47.7% |
| Immigrants | Cuba | 20.9 /100 | #201 | Fair 47.7% |
| Immigrants | Bahamas | 20.7 /100 | #202 | Fair 47.7% |
| Trinidadians and Tobagonians | 20.0 /100 | #203 | Fair 47.7% |
| Nigerians | 19.2 /100 | #204 | Poor 47.7% |
| Immigrants | Ghana | 19.1 /100 | #205 | Poor 47.7% |
| Jamaicans | 19.0 /100 | #206 | Poor 47.7% |
| Immigrants | Syria | 17.4 /100 | #207 | Poor 47.8% |
| Immigrants | Senegal | 16.9 /100 | #208 | Poor 47.8% |
| Immigrants | Indonesia | 14.2 /100 | #209 | Poor 47.8% |
| Vietnamese | 11.9 /100 | #210 | Poor 47.9% |
| Panamanians | 11.8 /100 | #211 | Poor 47.9% |
| Immigrants | Burma/Myanmar | 11.7 /100 | #212 | Poor 47.9% |
| Laotians | 11.5 /100 | #213 | Poor 47.9% |