Immigrants from Guyana vs Lebanese Disability Age Over 75
COMPARE
Immigrants from Guyana
Lebanese
Disability Age Over 75
Disability Age Over 75 Comparison
Immigrants from Guyana
Lebanese
47.1%
DISABILITY AGE OVER 75
71.9/ 100
METRIC RATING
158th/ 347
METRIC RANK
46.8%
DISABILITY AGE OVER 75
87.0/ 100
METRIC RATING
141st/ 347
METRIC RANK
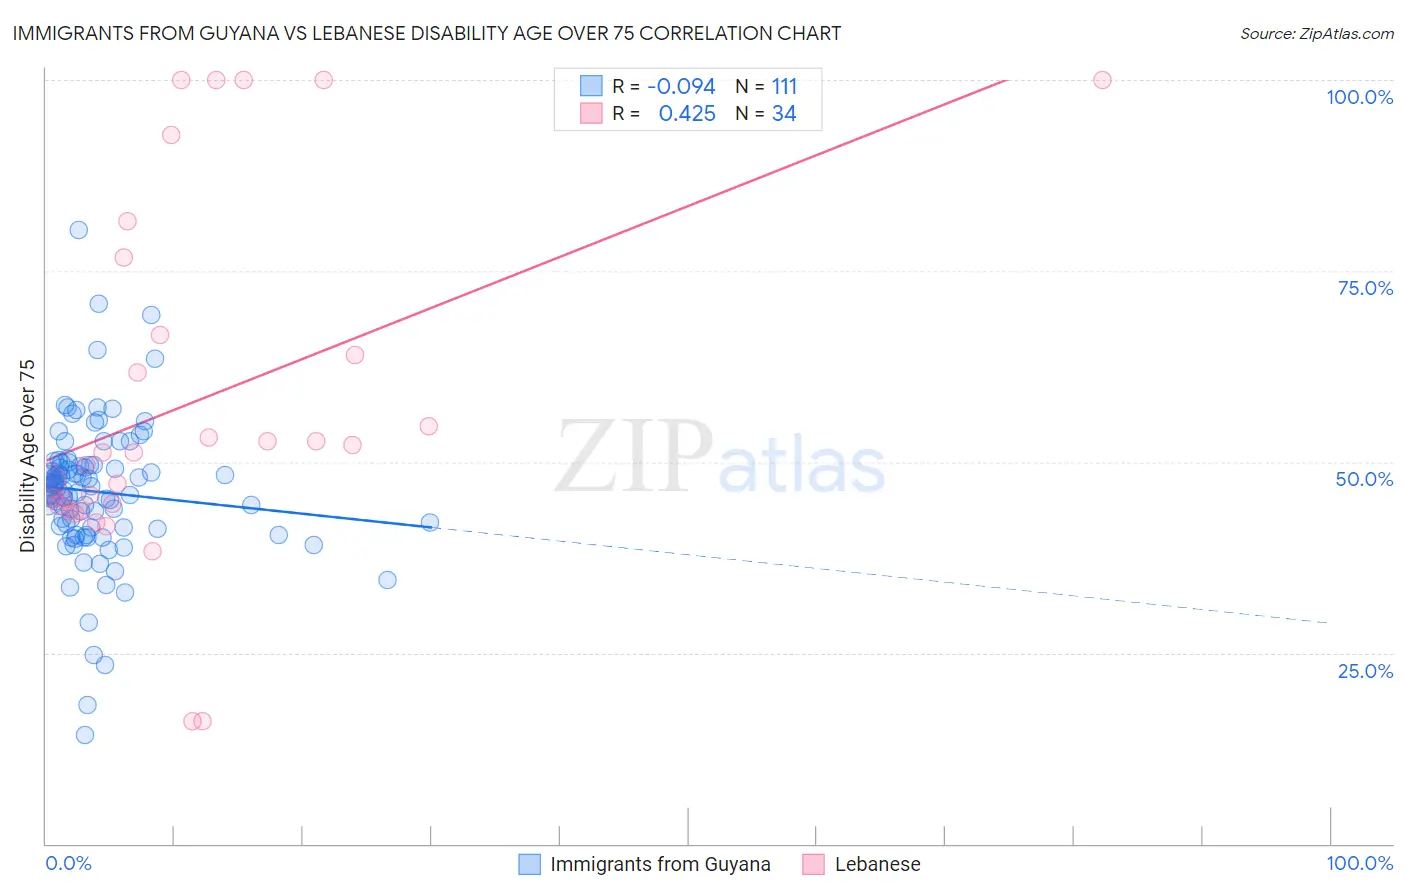
Immigrants from Guyana vs Lebanese Disability Age Over 75 Correlation Chart
The statistical analysis conducted on geographies consisting of 183,514,554 people shows a slight negative correlation between the proportion of Immigrants from Guyana and percentage of population with a disability over the age of 75 in the United States with a correlation coefficient (R) of -0.094 and weighted average of 47.1%. Similarly, the statistical analysis conducted on geographies consisting of 400,844,308 people shows a moderate positive correlation between the proportion of Lebanese and percentage of population with a disability over the age of 75 in the United States with a correlation coefficient (R) of 0.425 and weighted average of 46.8%, a difference of 0.54%.
Disability Age Over 75 Correlation Summary
| Measurement | Immigrants from Guyana | Lebanese |
| Minimum | 14.3% | 16.1% |
| Maximum | 80.4% | 100.0% |
| Range | 66.1% | 83.9% |
| Mean | 46.1% | 57.8% |
| Median | 46.7% | 51.2% |
| Interquartile 25% (IQ1) | 41.4% | 44.3% |
| Interquartile 75% (IQ3) | 49.5% | 66.7% |
| Interquartile Range (IQR) | 8.1% | 22.4% |
| Standard Deviation (Sample) | 9.1% | 23.0% |
| Standard Deviation (Population) | 9.1% | 22.7% |
Demographics Similar to Immigrants from Guyana and Lebanese by Disability Age Over 75
In terms of disability age over 75, the demographic groups most similar to Immigrants from Guyana are Immigrants from Morocco (47.1%, a difference of 0.010%), Bhutanese (47.1%, a difference of 0.020%), Arab (47.1%, a difference of 0.040%), Immigrants from Zaire (47.1%, a difference of 0.080%), and Immigrants from Belarus (47.1%, a difference of 0.080%). Similarly, the demographic groups most similar to Lebanese are Immigrants from Costa Rica (46.8%, a difference of 0.020%), Peruvian (46.8%, a difference of 0.020%), Bermudan (46.9%, a difference of 0.070%), Yugoslavian (46.8%, a difference of 0.080%), and Venezuelan (46.9%, a difference of 0.090%).
| Demographics | Rating | Rank | Disability Age Over 75 |
| Yugoslavians | 88.5 /100 | #139 | Excellent 46.8% |
| Immigrants | Costa Rica | 87.4 /100 | #140 | Excellent 46.8% |
| Lebanese | 87.0 /100 | #141 | Excellent 46.8% |
| Peruvians | 86.5 /100 | #142 | Excellent 46.8% |
| Bermudans | 85.6 /100 | #143 | Excellent 46.9% |
| Venezuelans | 85.0 /100 | #144 | Excellent 46.9% |
| Costa Ricans | 84.5 /100 | #145 | Excellent 46.9% |
| Guyanese | 84.3 /100 | #146 | Excellent 46.9% |
| Immigrants | Peru | 84.1 /100 | #147 | Excellent 46.9% |
| Asians | 81.6 /100 | #148 | Excellent 46.9% |
| Welsh | 81.3 /100 | #149 | Excellent 47.0% |
| Immigrants | Russia | 79.3 /100 | #150 | Good 47.0% |
| French Canadians | 79.0 /100 | #151 | Good 47.0% |
| Immigrants | Asia | 76.5 /100 | #152 | Good 47.0% |
| Immigrants | Zaire | 74.8 /100 | #153 | Good 47.1% |
| Immigrants | Belarus | 74.8 /100 | #154 | Good 47.1% |
| Immigrants | Iran | 74.7 /100 | #155 | Good 47.1% |
| Arabs | 73.3 /100 | #156 | Good 47.1% |
| Bhutanese | 72.6 /100 | #157 | Good 47.1% |
| Immigrants | Guyana | 71.9 /100 | #158 | Good 47.1% |
| Immigrants | Morocco | 71.4 /100 | #159 | Good 47.1% |