Immigrants from Dominica vs Lumbee Self-Care Disability
COMPARE
Immigrants from Dominica
Lumbee
Self-Care Disability
Self-Care Disability Comparison
Immigrants from Dominica
Lumbee
2.8%
SELF-CARE DISABILITY
0.0/ 100
METRIC RATING
317th/ 347
METRIC RANK
3.0%
SELF-CARE DISABILITY
0.0/ 100
METRIC RATING
331st/ 347
METRIC RANK
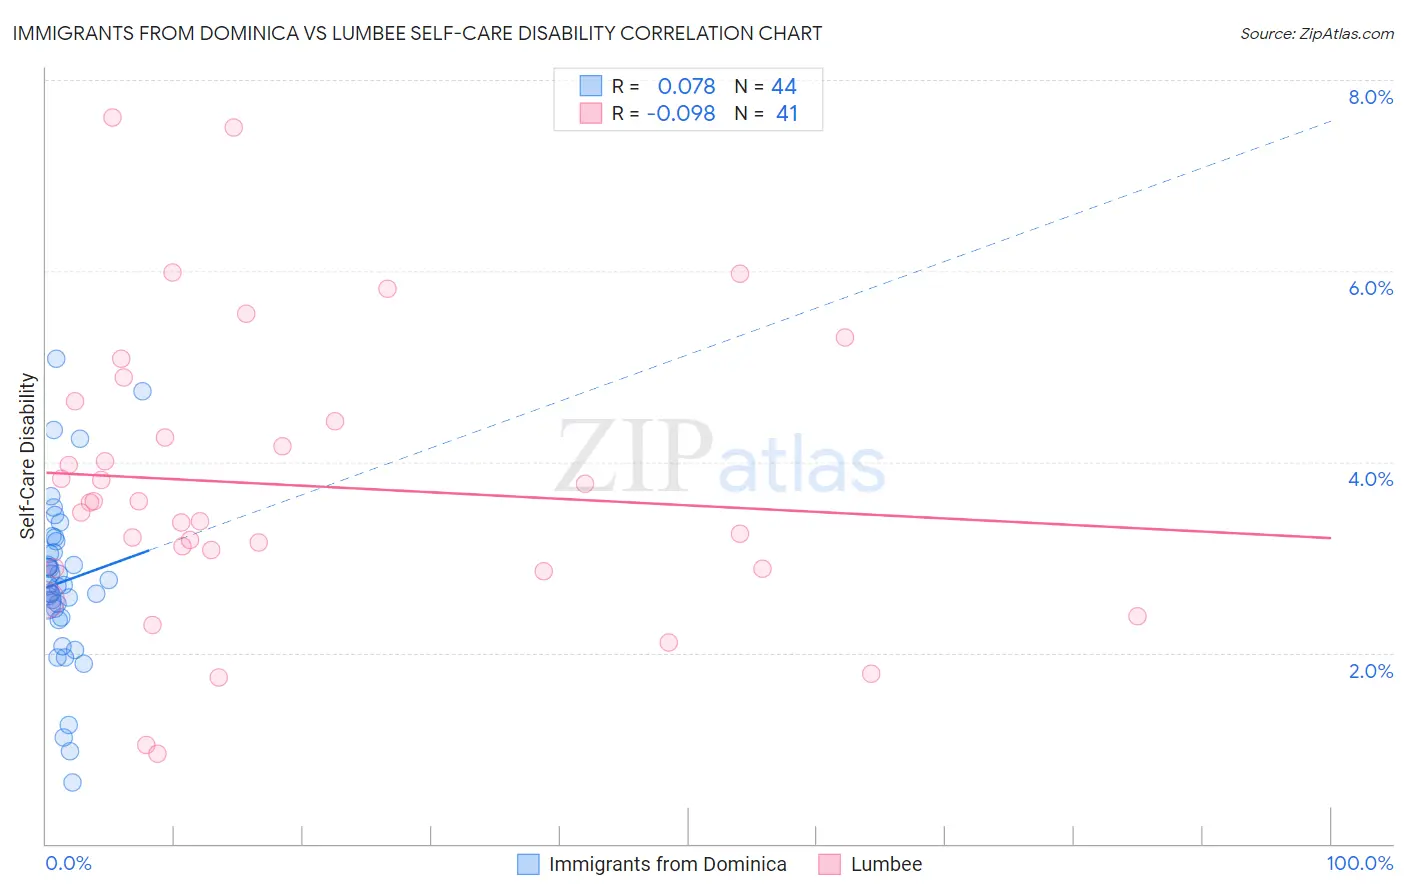
Immigrants from Dominica vs Lumbee Self-Care Disability Correlation Chart
The statistical analysis conducted on geographies consisting of 83,776,311 people shows a slight positive correlation between the proportion of Immigrants from Dominica and percentage of population with self-care disability in the United States with a correlation coefficient (R) of 0.078 and weighted average of 2.8%. Similarly, the statistical analysis conducted on geographies consisting of 92,217,287 people shows a slight negative correlation between the proportion of Lumbee and percentage of population with self-care disability in the United States with a correlation coefficient (R) of -0.098 and weighted average of 3.0%, a difference of 4.2%.
Self-Care Disability Correlation Summary
| Measurement | Immigrants from Dominica | Lumbee |
| Minimum | 0.64% | 0.94% |
| Maximum | 5.1% | 7.6% |
| Range | 4.4% | 6.7% |
| Mean | 2.7% | 3.8% |
| Median | 2.7% | 3.6% |
| Interquartile 25% (IQ1) | 2.4% | 2.9% |
| Interquartile 75% (IQ3) | 3.1% | 4.5% |
| Interquartile Range (IQR) | 0.69% | 1.6% |
| Standard Deviation (Sample) | 0.88% | 1.5% |
| Standard Deviation (Population) | 0.87% | 1.5% |
Demographics Similar to Immigrants from Dominica and Lumbee by Self-Care Disability
In terms of self-care disability, the demographic groups most similar to Immigrants from Dominica are Assyrian/Chaldean/Syriac (2.8%, a difference of 0.010%), Menominee (2.8%, a difference of 0.13%), Spanish American Indian (2.9%, a difference of 0.17%), Immigrants from Cuba (2.8%, a difference of 0.23%), and Chickasaw (2.9%, a difference of 0.38%). Similarly, the demographic groups most similar to Lumbee are Nepalese (3.0%, a difference of 0.12%), Kiowa (3.0%, a difference of 0.36%), Dutch West Indian (3.0%, a difference of 0.59%), Houma (3.0%, a difference of 0.66%), and Cajun (2.9%, a difference of 0.87%).
| Demographics | Rating | Rank | Self-Care Disability |
| Creek | 0.0 /100 | #314 | Tragic 2.8% |
| Immigrants | Cuba | 0.0 /100 | #315 | Tragic 2.8% |
| Menominee | 0.0 /100 | #316 | Tragic 2.8% |
| Immigrants | Dominica | 0.0 /100 | #317 | Tragic 2.8% |
| Assyrians/Chaldeans/Syriacs | 0.0 /100 | #318 | Tragic 2.8% |
| Spanish American Indians | 0.0 /100 | #319 | Tragic 2.9% |
| Chickasaw | 0.0 /100 | #320 | Tragic 2.9% |
| Navajo | 0.0 /100 | #321 | Tragic 2.9% |
| Comanche | 0.0 /100 | #322 | Tragic 2.9% |
| Seminole | 0.0 /100 | #323 | Tragic 2.9% |
| Cherokee | 0.0 /100 | #324 | Tragic 2.9% |
| Immigrants | Uzbekistan | 0.0 /100 | #325 | Tragic 2.9% |
| Paiute | 0.0 /100 | #326 | Tragic 2.9% |
| Blacks/African Americans | 0.0 /100 | #327 | Tragic 2.9% |
| Hopi | 0.0 /100 | #328 | Tragic 2.9% |
| Cajuns | 0.0 /100 | #329 | Tragic 2.9% |
| Nepalese | 0.0 /100 | #330 | Tragic 3.0% |
| Lumbee | 0.0 /100 | #331 | Tragic 3.0% |
| Kiowa | 0.0 /100 | #332 | Tragic 3.0% |
| Dutch West Indians | 0.0 /100 | #333 | Tragic 3.0% |
| Houma | 0.0 /100 | #334 | Tragic 3.0% |