Immigrants from China vs Hawaiian Female Disability
COMPARE
Immigrants from China
Hawaiian
Female Disability
Female Disability Comparison
Immigrants from China
Hawaiians
10.7%
FEMALE DISABILITY
100.0/ 100
METRIC RATING
14th/ 347
METRIC RANK
12.7%
FEMALE DISABILITY
1.4/ 100
METRIC RATING
254th/ 347
METRIC RANK
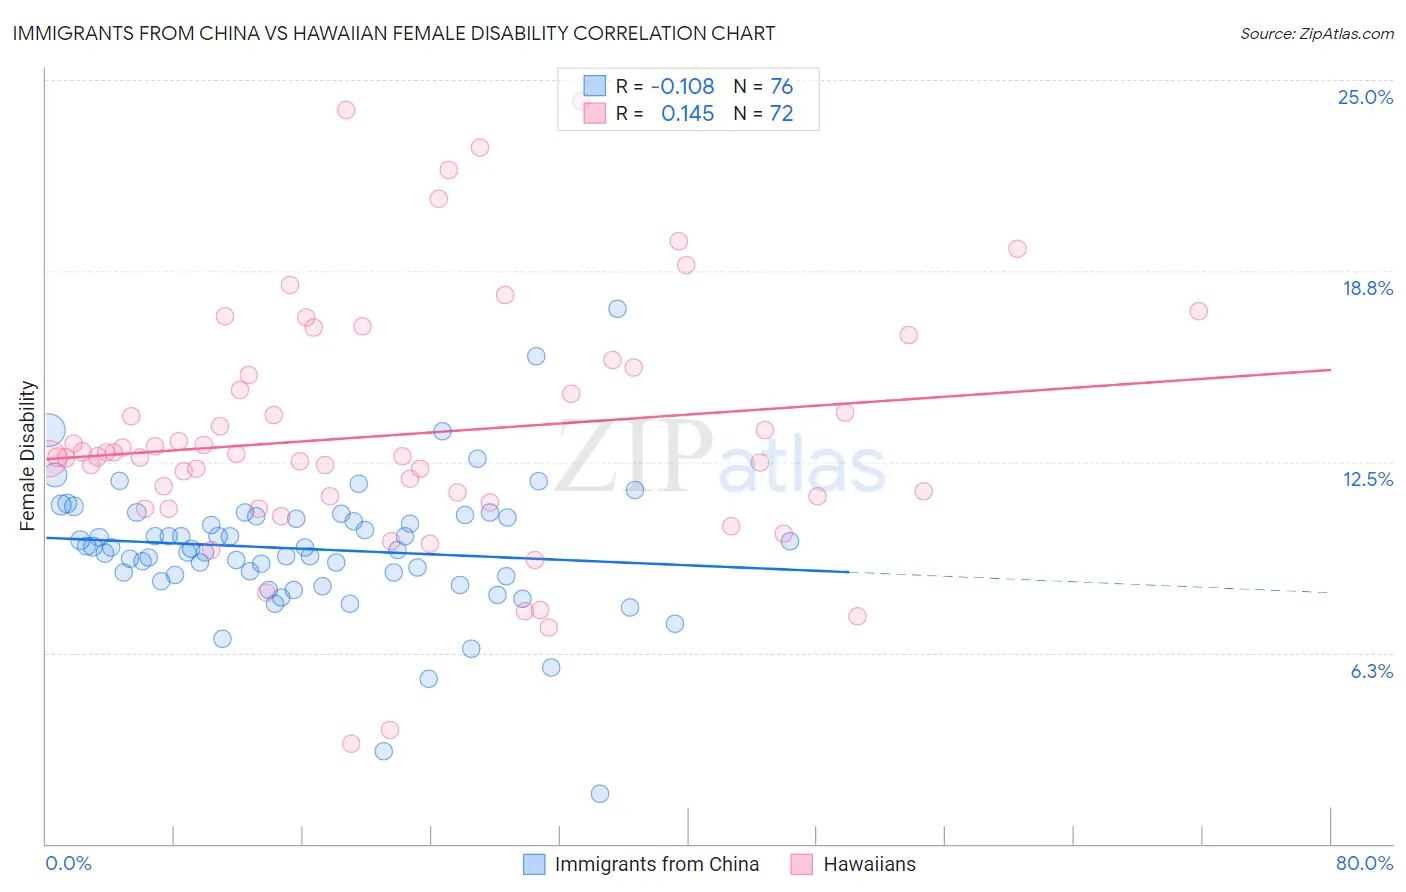
Immigrants from China vs Hawaiian Female Disability Correlation Chart
The statistical analysis conducted on geographies consisting of 457,020,371 people shows a poor negative correlation between the proportion of Immigrants from China and percentage of females with a disability in the United States with a correlation coefficient (R) of -0.108 and weighted average of 10.7%. Similarly, the statistical analysis conducted on geographies consisting of 327,480,697 people shows a poor positive correlation between the proportion of Hawaiians and percentage of females with a disability in the United States with a correlation coefficient (R) of 0.145 and weighted average of 12.7%, a difference of 18.6%.
Female Disability Correlation Summary
| Measurement | Immigrants from China | Hawaiian |
| Minimum | 1.6% | 3.3% |
| Maximum | 17.5% | 24.3% |
| Range | 15.9% | 21.1% |
| Mean | 9.6% | 13.4% |
| Median | 9.7% | 12.7% |
| Interquartile 25% (IQ1) | 8.8% | 11.3% |
| Interquartile 75% (IQ3) | 10.7% | 15.5% |
| Interquartile Range (IQR) | 1.9% | 4.2% |
| Standard Deviation (Sample) | 2.3% | 4.1% |
| Standard Deviation (Population) | 2.2% | 4.1% |
Similar Demographics by Female Disability
Demographics Similar to Immigrants from China by Female Disability
In terms of female disability, the demographic groups most similar to Immigrants from China are Immigrants from Eastern Asia (10.7%, a difference of 0.040%), Immigrants from Israel (10.7%, a difference of 0.11%), Burmese (10.7%, a difference of 0.51%), Immigrants from Korea (10.6%, a difference of 0.52%), and Okinawan (10.8%, a difference of 0.58%).
| Demographics | Rating | Rank | Female Disability |
| Immigrants | Singapore | 100.0 /100 | #7 | Exceptional 10.4% |
| Immigrants | South Central Asia | 100.0 /100 | #8 | Exceptional 10.5% |
| Iranians | 100.0 /100 | #9 | Exceptional 10.6% |
| Immigrants | Hong Kong | 100.0 /100 | #10 | Exceptional 10.6% |
| Immigrants | Korea | 100.0 /100 | #11 | Exceptional 10.6% |
| Immigrants | Israel | 100.0 /100 | #12 | Exceptional 10.7% |
| Immigrants | Eastern Asia | 100.0 /100 | #13 | Exceptional 10.7% |
| Immigrants | China | 100.0 /100 | #14 | Exceptional 10.7% |
| Burmese | 100.0 /100 | #15 | Exceptional 10.7% |
| Okinawans | 100.0 /100 | #16 | Exceptional 10.8% |
| Indians (Asian) | 100.0 /100 | #17 | Exceptional 10.8% |
| Immigrants | Iran | 100.0 /100 | #18 | Exceptional 10.8% |
| Immigrants | Venezuela | 100.0 /100 | #19 | Exceptional 10.9% |
| Immigrants | Pakistan | 100.0 /100 | #20 | Exceptional 10.9% |
| Asians | 100.0 /100 | #21 | Exceptional 10.9% |
Demographics Similar to Hawaiians by Female Disability
In terms of female disability, the demographic groups most similar to Hawaiians are Jamaican (12.7%, a difference of 0.030%), Immigrants from Caribbean (12.7%, a difference of 0.040%), Immigrants from Germany (12.7%, a difference of 0.080%), Crow (12.7%, a difference of 0.12%), and British West Indian (12.7%, a difference of 0.15%).
| Demographics | Rating | Rank | Female Disability |
| Menominee | 2.1 /100 | #247 | Tragic 12.6% |
| Carpatho Rusyns | 2.0 /100 | #248 | Tragic 12.6% |
| Immigrants | Congo | 1.8 /100 | #249 | Tragic 12.7% |
| Slovenes | 1.7 /100 | #250 | Tragic 12.7% |
| Crow | 1.6 /100 | #251 | Tragic 12.7% |
| Immigrants | Caribbean | 1.4 /100 | #252 | Tragic 12.7% |
| Jamaicans | 1.4 /100 | #253 | Tragic 12.7% |
| Hawaiians | 1.4 /100 | #254 | Tragic 12.7% |
| Immigrants | Germany | 1.3 /100 | #255 | Tragic 12.7% |
| British West Indians | 1.2 /100 | #256 | Tragic 12.7% |
| Liberians | 1.1 /100 | #257 | Tragic 12.7% |
| Aleuts | 1.1 /100 | #258 | Tragic 12.7% |
| Immigrants | Armenia | 1.0 /100 | #259 | Tragic 12.7% |
| Sub-Saharan Africans | 1.0 /100 | #260 | Tragic 12.7% |
| Bermudans | 1.0 /100 | #261 | Tragic 12.7% |