Immigrants from Chile vs Afghan Vision Disability
COMPARE
Immigrants from Chile
Afghan
Vision Disability
Vision Disability Comparison
Immigrants from Chile
Afghans
2.1%
VISION DISABILITY
89.0/ 100
METRIC RATING
128th/ 347
METRIC RANK
2.0%
VISION DISABILITY
99.5/ 100
METRIC RATING
50th/ 347
METRIC RANK
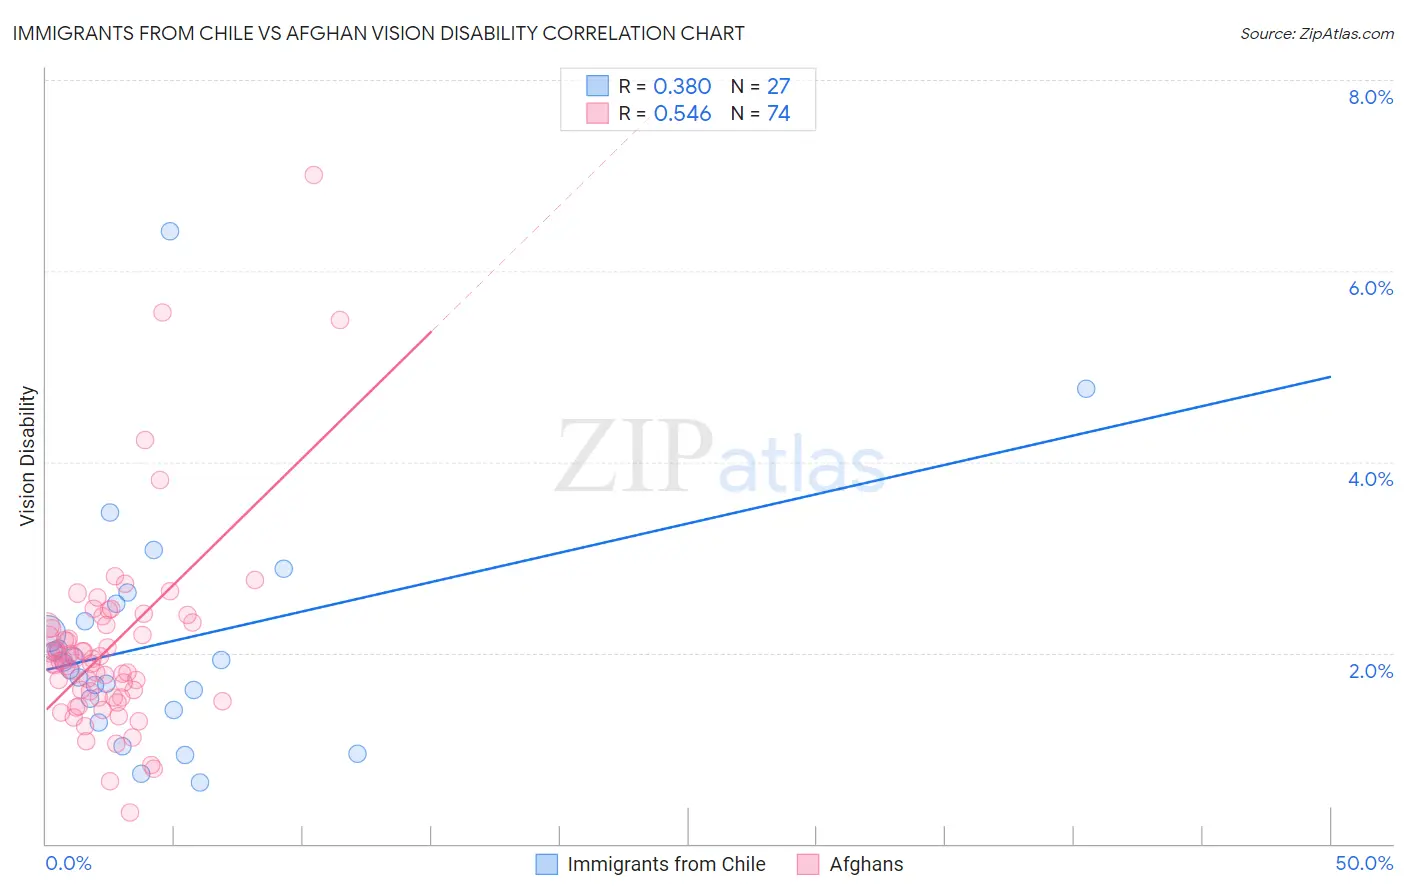
Immigrants from Chile vs Afghan Vision Disability Correlation Chart
The statistical analysis conducted on geographies consisting of 218,580,502 people shows a mild positive correlation between the proportion of Immigrants from Chile and percentage of population with vision disability in the United States with a correlation coefficient (R) of 0.380 and weighted average of 2.1%. Similarly, the statistical analysis conducted on geographies consisting of 148,842,568 people shows a substantial positive correlation between the proportion of Afghans and percentage of population with vision disability in the United States with a correlation coefficient (R) of 0.546 and weighted average of 2.0%, a difference of 5.6%.
Vision Disability Correlation Summary
| Measurement | Immigrants from Chile | Afghan |
| Minimum | 0.64% | 0.32% |
| Maximum | 6.4% | 7.0% |
| Range | 5.8% | 6.7% |
| Mean | 2.1% | 2.1% |
| Median | 1.9% | 1.9% |
| Interquartile 25% (IQ1) | 1.4% | 1.5% |
| Interquartile 75% (IQ3) | 2.5% | 2.3% |
| Interquartile Range (IQR) | 1.1% | 0.76% |
| Standard Deviation (Sample) | 1.2% | 1.0% |
| Standard Deviation (Population) | 1.2% | 1.0% |
Similar Demographics by Vision Disability
Demographics Similar to Immigrants from Chile by Vision Disability
In terms of vision disability, the demographic groups most similar to Immigrants from Chile are Sudanese (2.1%, a difference of 0.030%), Immigrants from Cameroon (2.1%, a difference of 0.030%), Immigrants from Kenya (2.1%, a difference of 0.040%), Immigrants from Hungary (2.1%, a difference of 0.050%), and Immigrants from Peru (2.1%, a difference of 0.10%).
| Demographics | Rating | Rank | Vision Disability |
| Immigrants | Scotland | 90.4 /100 | #121 | Exceptional 2.1% |
| Immigrants | Ukraine | 90.4 /100 | #122 | Exceptional 2.1% |
| Immigrants | Albania | 90.4 /100 | #123 | Exceptional 2.1% |
| Immigrants | Spain | 89.8 /100 | #124 | Excellent 2.1% |
| Immigrants | Venezuela | 89.8 /100 | #125 | Excellent 2.1% |
| Immigrants | Peru | 89.5 /100 | #126 | Excellent 2.1% |
| Sudanese | 89.2 /100 | #127 | Excellent 2.1% |
| Immigrants | Chile | 89.0 /100 | #128 | Excellent 2.1% |
| Immigrants | Cameroon | 88.8 /100 | #129 | Excellent 2.1% |
| Immigrants | Kenya | 88.7 /100 | #130 | Excellent 2.1% |
| Immigrants | Hungary | 88.7 /100 | #131 | Excellent 2.1% |
| New Zealanders | 88.2 /100 | #132 | Excellent 2.1% |
| Syrians | 87.5 /100 | #133 | Excellent 2.1% |
| Venezuelans | 87.2 /100 | #134 | Excellent 2.1% |
| Vietnamese | 86.7 /100 | #135 | Excellent 2.1% |
Demographics Similar to Afghans by Vision Disability
In terms of vision disability, the demographic groups most similar to Afghans are Latvian (2.0%, a difference of 0.060%), Tongan (2.0%, a difference of 0.090%), Israeli (2.0%, a difference of 0.13%), Immigrants from Serbia (2.0%, a difference of 0.40%), and Immigrants from Belarus (2.0%, a difference of 0.51%).
| Demographics | Rating | Rank | Vision Disability |
| Eastern Europeans | 99.7 /100 | #43 | Exceptional 2.0% |
| Immigrants | Indonesia | 99.7 /100 | #44 | Exceptional 2.0% |
| Ethiopians | 99.7 /100 | #45 | Exceptional 2.0% |
| Immigrants | Sweden | 99.7 /100 | #46 | Exceptional 2.0% |
| Immigrants | Bulgaria | 99.7 /100 | #47 | Exceptional 2.0% |
| Israelis | 99.6 /100 | #48 | Exceptional 2.0% |
| Latvians | 99.5 /100 | #49 | Exceptional 2.0% |
| Afghans | 99.5 /100 | #50 | Exceptional 2.0% |
| Tongans | 99.5 /100 | #51 | Exceptional 2.0% |
| Immigrants | Serbia | 99.4 /100 | #52 | Exceptional 2.0% |
| Immigrants | Belarus | 99.3 /100 | #53 | Exceptional 2.0% |
| Macedonians | 99.3 /100 | #54 | Exceptional 2.0% |
| Laotians | 99.3 /100 | #55 | Exceptional 2.0% |
| Jordanians | 99.2 /100 | #56 | Exceptional 2.0% |
| Somalis | 99.2 /100 | #57 | Exceptional 2.0% |