Immigrants from Canada vs Immigrants from El Salvador Female Disability
COMPARE
Immigrants from Canada
Immigrants from El Salvador
Female Disability
Female Disability Comparison
Immigrants from Canada
Immigrants from El Salvador
12.3%
FEMALE DISABILITY
37.2/ 100
METRIC RATING
181st/ 347
METRIC RANK
11.4%
FEMALE DISABILITY
99.9/ 100
METRIC RATING
64th/ 347
METRIC RANK
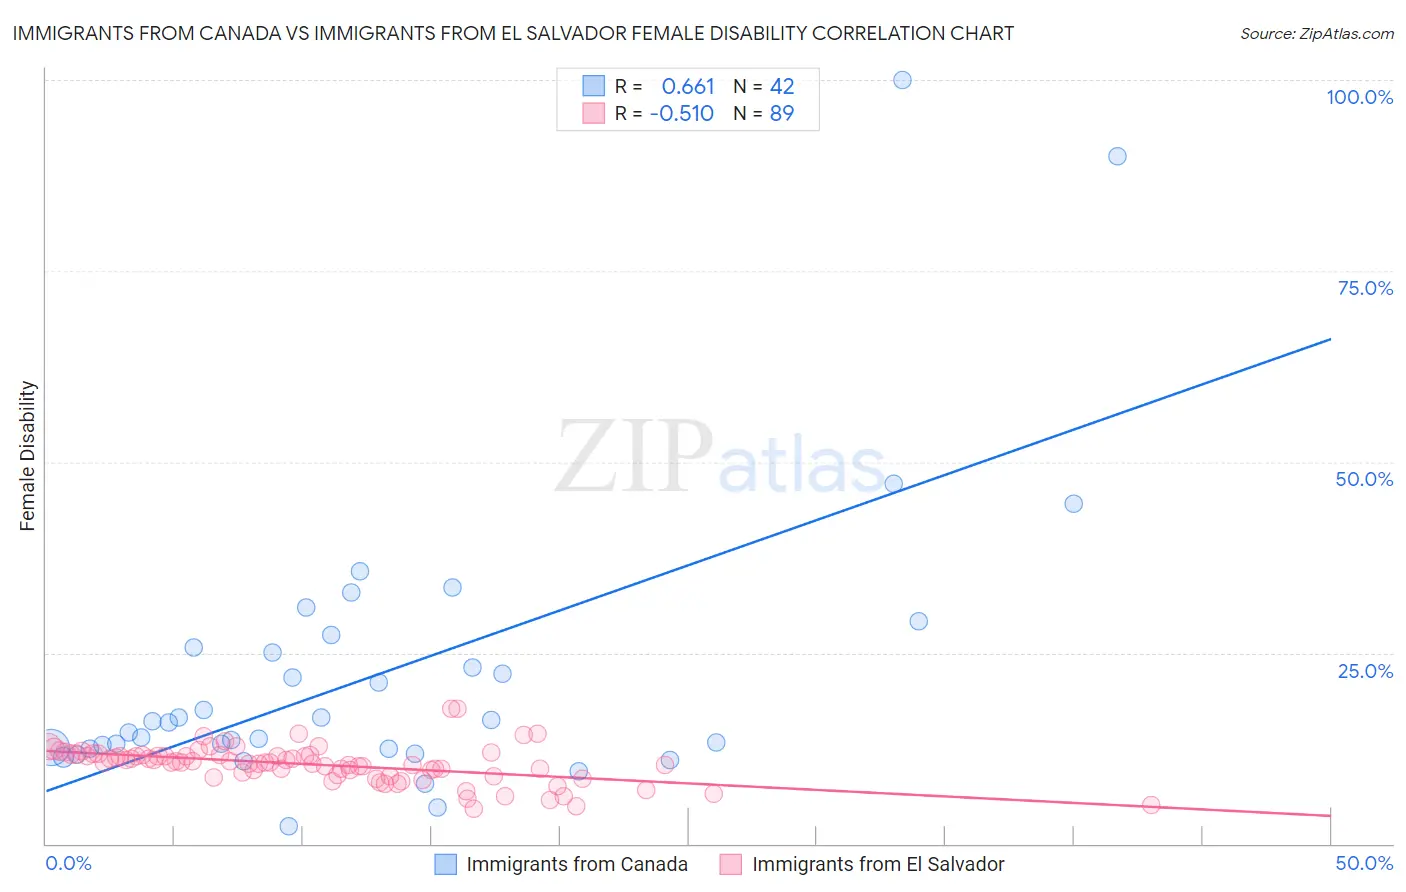
Immigrants from Canada vs Immigrants from El Salvador Female Disability Correlation Chart
The statistical analysis conducted on geographies consisting of 459,343,053 people shows a significant positive correlation between the proportion of Immigrants from Canada and percentage of females with a disability in the United States with a correlation coefficient (R) of 0.661 and weighted average of 12.3%. Similarly, the statistical analysis conducted on geographies consisting of 357,763,756 people shows a substantial negative correlation between the proportion of Immigrants from El Salvador and percentage of females with a disability in the United States with a correlation coefficient (R) of -0.510 and weighted average of 11.4%, a difference of 7.1%.
Female Disability Correlation Summary
| Measurement | Immigrants from Canada | Immigrants from El Salvador |
| Minimum | 2.3% | 4.5% |
| Maximum | 100.0% | 17.7% |
| Range | 97.7% | 13.2% |
| Mean | 22.3% | 10.4% |
| Median | 16.0% | 10.6% |
| Interquartile 25% (IQ1) | 12.5% | 8.9% |
| Interquartile 75% (IQ3) | 25.7% | 11.6% |
| Interquartile Range (IQR) | 13.2% | 2.7% |
| Standard Deviation (Sample) | 19.2% | 2.4% |
| Standard Deviation (Population) | 19.0% | 2.4% |
Similar Demographics by Female Disability
Demographics Similar to Immigrants from Canada by Female Disability
In terms of female disability, the demographic groups most similar to Immigrants from Canada are Norwegian (12.3%, a difference of 0.010%), Albanian (12.3%, a difference of 0.030%), Cuban (12.3%, a difference of 0.030%), Immigrants from Fiji (12.3%, a difference of 0.040%), and Iraqi (12.3%, a difference of 0.050%).
| Demographics | Rating | Rank | Female Disability |
| Immigrants | England | 50.0 /100 | #174 | Average 12.2% |
| Immigrants | St. Vincent and the Grenadines | 49.7 /100 | #175 | Average 12.2% |
| Immigrants | Guyana | 43.1 /100 | #176 | Average 12.2% |
| Immigrants | Ghana | 42.5 /100 | #177 | Average 12.2% |
| Immigrants | Western Europe | 40.9 /100 | #178 | Average 12.2% |
| Immigrants | Fiji | 38.2 /100 | #179 | Fair 12.3% |
| Albanians | 37.9 /100 | #180 | Fair 12.3% |
| Immigrants | Canada | 37.2 /100 | #181 | Fair 12.3% |
| Norwegians | 36.9 /100 | #182 | Fair 12.3% |
| Cubans | 36.5 /100 | #183 | Fair 12.3% |
| Iraqis | 36.0 /100 | #184 | Fair 12.3% |
| Immigrants | Uzbekistan | 33.9 /100 | #185 | Fair 12.3% |
| Austrians | 33.3 /100 | #186 | Fair 12.3% |
| Serbians | 33.1 /100 | #187 | Fair 12.3% |
| Immigrants | North America | 32.8 /100 | #188 | Fair 12.3% |
Demographics Similar to Immigrants from El Salvador by Female Disability
In terms of female disability, the demographic groups most similar to Immigrants from El Salvador are Immigrants from South America (11.4%, a difference of 0.020%), Immigrants from Colombia (11.4%, a difference of 0.070%), Sri Lankan (11.4%, a difference of 0.17%), Salvadoran (11.5%, a difference of 0.19%), and Immigrants from Vietnam (11.5%, a difference of 0.24%).
| Demographics | Rating | Rank | Female Disability |
| South Americans | 99.9 /100 | #57 | Exceptional 11.4% |
| Laotians | 99.9 /100 | #58 | Exceptional 11.4% |
| Immigrants | Spain | 99.9 /100 | #59 | Exceptional 11.4% |
| Immigrants | Bulgaria | 99.9 /100 | #60 | Exceptional 11.4% |
| Immigrants | France | 99.9 /100 | #61 | Exceptional 11.4% |
| Sri Lankans | 99.9 /100 | #62 | Exceptional 11.4% |
| Immigrants | Colombia | 99.9 /100 | #63 | Exceptional 11.4% |
| Immigrants | El Salvador | 99.9 /100 | #64 | Exceptional 11.4% |
| Immigrants | South America | 99.9 /100 | #65 | Exceptional 11.4% |
| Salvadorans | 99.8 /100 | #66 | Exceptional 11.5% |
| Immigrants | Vietnam | 99.8 /100 | #67 | Exceptional 11.5% |
| Immigrants | Northern Africa | 99.8 /100 | #68 | Exceptional 11.5% |
| Colombians | 99.8 /100 | #69 | Exceptional 11.5% |
| Immigrants | Chile | 99.8 /100 | #70 | Exceptional 11.5% |
| Immigrants | Ireland | 99.8 /100 | #71 | Exceptional 11.5% |