Immigrants from Cameroon vs Immigrants from Dominica Disability
COMPARE
Immigrants from Cameroon
Immigrants from Dominica
Disability
Disability Comparison
Immigrants from Cameroon
Immigrants from Dominica
11.1%
DISABILITY
99.3/ 100
METRIC RATING
78th/ 347
METRIC RANK
12.4%
DISABILITY
0.6/ 100
METRIC RATING
256th/ 347
METRIC RANK
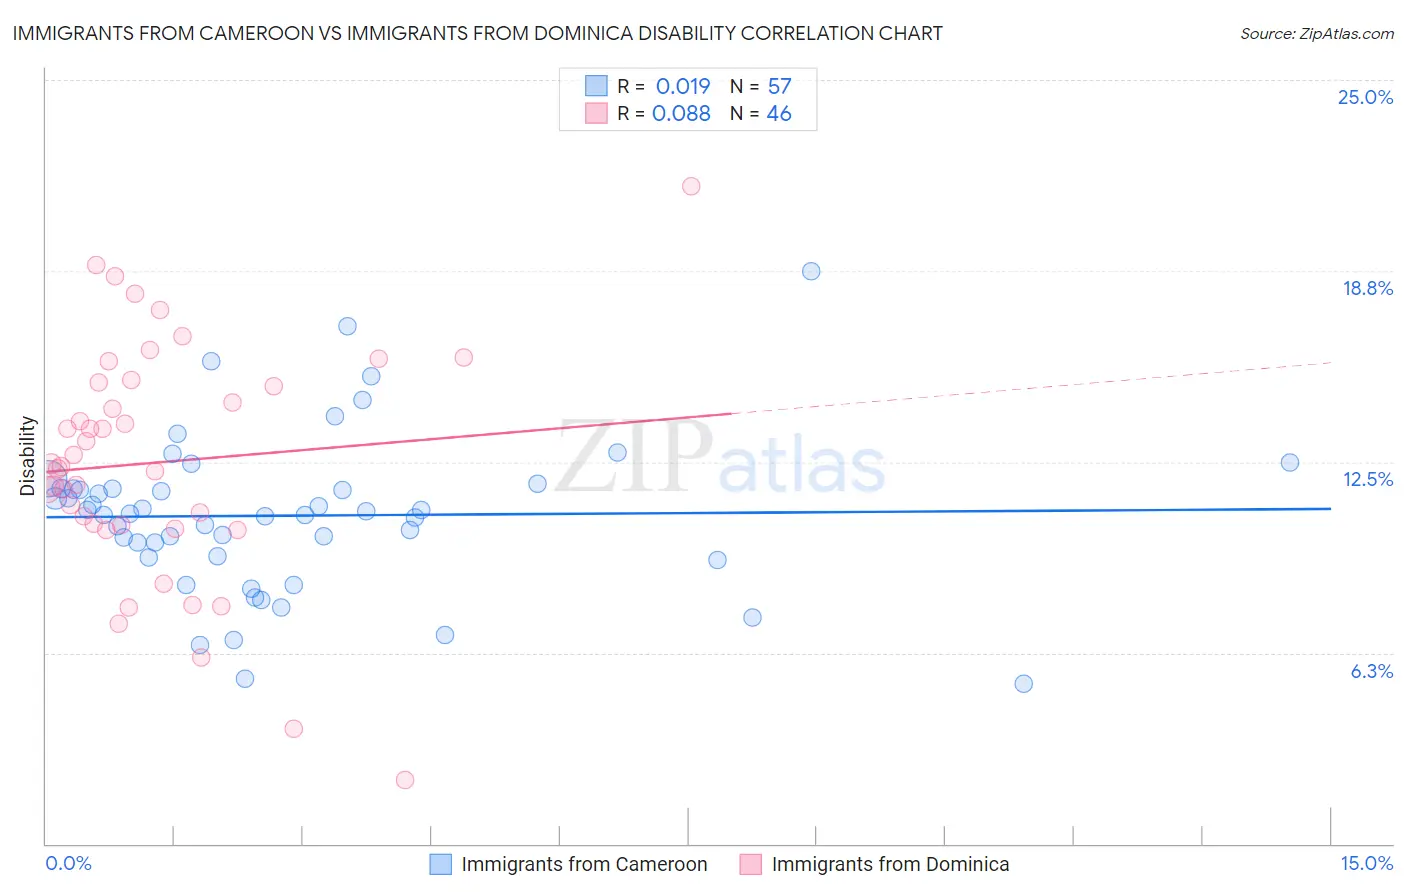
Immigrants from Cameroon vs Immigrants from Dominica Disability Correlation Chart
The statistical analysis conducted on geographies consisting of 130,761,235 people shows no correlation between the proportion of Immigrants from Cameroon and percentage of population with a disability in the United States with a correlation coefficient (R) of 0.019 and weighted average of 11.1%. Similarly, the statistical analysis conducted on geographies consisting of 83,793,635 people shows a slight positive correlation between the proportion of Immigrants from Dominica and percentage of population with a disability in the United States with a correlation coefficient (R) of 0.088 and weighted average of 12.4%, a difference of 11.9%.
Disability Correlation Summary
| Measurement | Immigrants from Cameroon | Immigrants from Dominica |
| Minimum | 5.2% | 2.1% |
| Maximum | 18.7% | 21.5% |
| Range | 13.5% | 19.4% |
| Mean | 10.7% | 12.5% |
| Median | 10.8% | 12.4% |
| Interquartile 25% (IQ1) | 9.4% | 10.4% |
| Interquartile 75% (IQ3) | 11.6% | 15.1% |
| Interquartile Range (IQR) | 2.3% | 4.7% |
| Standard Deviation (Sample) | 2.6% | 3.9% |
| Standard Deviation (Population) | 2.6% | 3.9% |
Similar Demographics by Disability
Demographics Similar to Immigrants from Cameroon by Disability
In terms of disability, the demographic groups most similar to Immigrants from Cameroon are Sierra Leonean (11.0%, a difference of 0.040%), Immigrants from Belgium (11.0%, a difference of 0.040%), Immigrants from Jordan (11.1%, a difference of 0.040%), Immigrants from Vietnam (11.0%, a difference of 0.070%), and Immigrants from Ireland (11.1%, a difference of 0.080%).
| Demographics | Rating | Rank | Disability |
| Immigrants | Lebanon | 99.4 /100 | #71 | Exceptional 11.0% |
| Immigrants | Chile | 99.4 /100 | #72 | Exceptional 11.0% |
| Immigrants | Bangladesh | 99.4 /100 | #73 | Exceptional 11.0% |
| Immigrants | Serbia | 99.4 /100 | #74 | Exceptional 11.0% |
| Immigrants | Vietnam | 99.4 /100 | #75 | Exceptional 11.0% |
| Sierra Leoneans | 99.3 /100 | #76 | Exceptional 11.0% |
| Immigrants | Belgium | 99.3 /100 | #77 | Exceptional 11.0% |
| Immigrants | Cameroon | 99.3 /100 | #78 | Exceptional 11.1% |
| Immigrants | Jordan | 99.3 /100 | #79 | Exceptional 11.1% |
| Immigrants | Ireland | 99.3 /100 | #80 | Exceptional 11.1% |
| Immigrants | Poland | 99.1 /100 | #81 | Exceptional 11.1% |
| Chileans | 99.1 /100 | #82 | Exceptional 11.1% |
| Immigrants | Switzerland | 99.0 /100 | #83 | Exceptional 11.1% |
| Immigrants | Sierra Leone | 99.0 /100 | #84 | Exceptional 11.1% |
| Immigrants | Belarus | 98.9 /100 | #85 | Exceptional 11.1% |
Demographics Similar to Immigrants from Dominica by Disability
In terms of disability, the demographic groups most similar to Immigrants from Dominica are Slovene (12.4%, a difference of 0.070%), Immigrants from Laos (12.4%, a difference of 0.090%), Slavic (12.4%, a difference of 0.23%), Canadian (12.4%, a difference of 0.29%), and Immigrants from Liberia (12.4%, a difference of 0.32%).
| Demographics | Rating | Rank | Disability |
| Carpatho Rusyns | 1.4 /100 | #249 | Tragic 12.3% |
| Sub-Saharan Africans | 1.4 /100 | #250 | Tragic 12.3% |
| Europeans | 1.4 /100 | #251 | Tragic 12.3% |
| Bermudans | 1.1 /100 | #252 | Tragic 12.3% |
| Belgians | 0.8 /100 | #253 | Tragic 12.3% |
| German Russians | 0.8 /100 | #254 | Tragic 12.3% |
| Slovenes | 0.6 /100 | #255 | Tragic 12.4% |
| Immigrants | Dominica | 0.6 /100 | #256 | Tragic 12.4% |
| Immigrants | Laos | 0.5 /100 | #257 | Tragic 12.4% |
| Slavs | 0.5 /100 | #258 | Tragic 12.4% |
| Canadians | 0.4 /100 | #259 | Tragic 12.4% |
| Immigrants | Liberia | 0.4 /100 | #260 | Tragic 12.4% |
| Scandinavians | 0.4 /100 | #261 | Tragic 12.4% |
| Native Hawaiians | 0.3 /100 | #262 | Tragic 12.5% |
| Hawaiians | 0.2 /100 | #263 | Tragic 12.5% |