Immigrants from Cameroon vs Immigrants from Singapore Disability
COMPARE
Immigrants from Cameroon
Immigrants from Singapore
Disability
Disability Comparison
Immigrants from Cameroon
Immigrants from Singapore
11.1%
DISABILITY
99.3/ 100
METRIC RATING
78th/ 347
METRIC RANK
10.0%
DISABILITY
100.0/ 100
METRIC RATING
7th/ 347
METRIC RANK
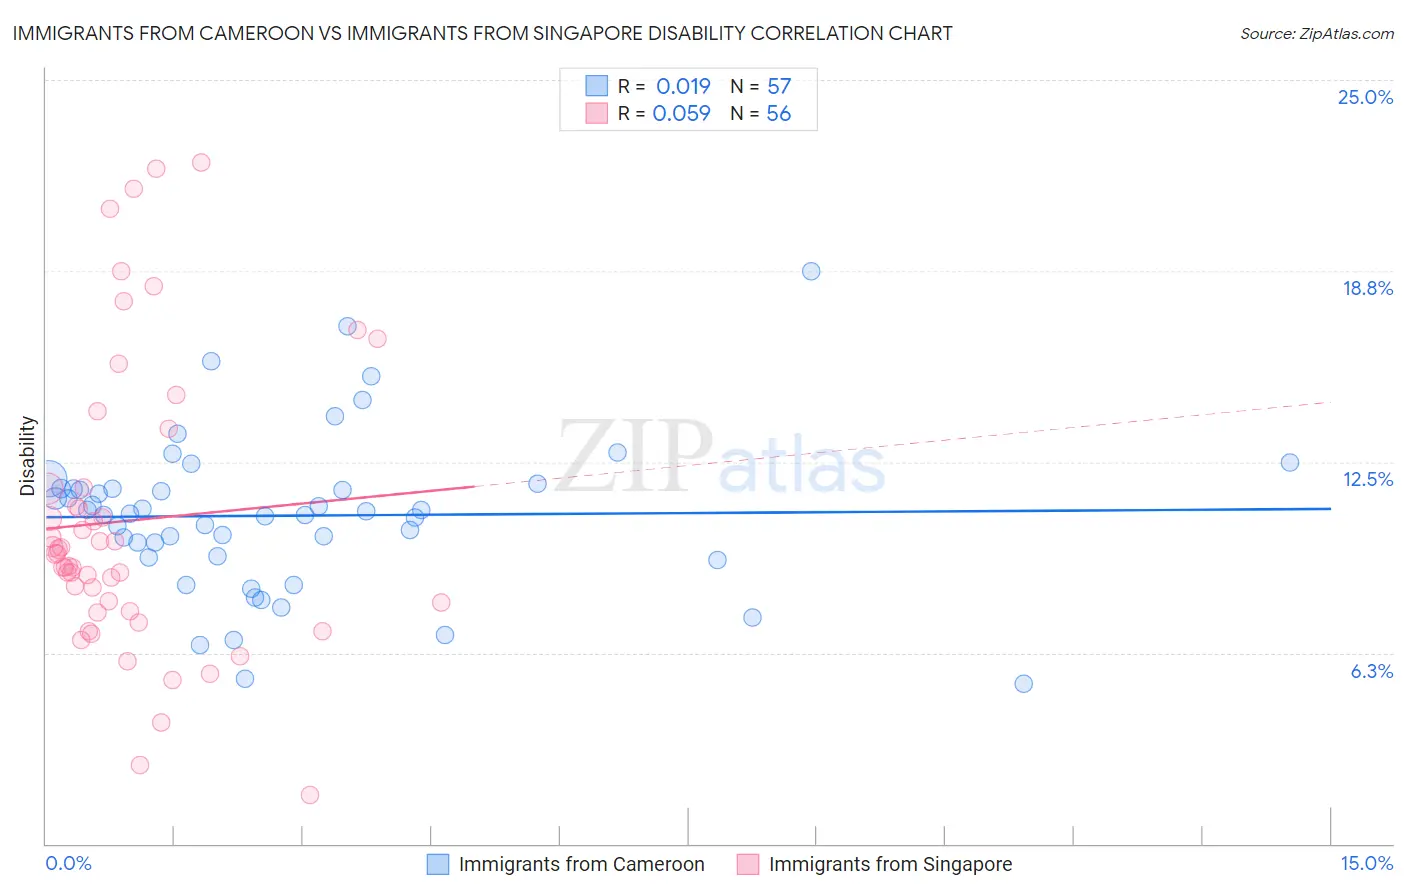
Immigrants from Cameroon vs Immigrants from Singapore Disability Correlation Chart
The statistical analysis conducted on geographies consisting of 130,761,235 people shows no correlation between the proportion of Immigrants from Cameroon and percentage of population with a disability in the United States with a correlation coefficient (R) of 0.019 and weighted average of 11.1%. Similarly, the statistical analysis conducted on geographies consisting of 137,520,897 people shows a slight positive correlation between the proportion of Immigrants from Singapore and percentage of population with a disability in the United States with a correlation coefficient (R) of 0.059 and weighted average of 10.0%, a difference of 10.8%.
Disability Correlation Summary
| Measurement | Immigrants from Cameroon | Immigrants from Singapore |
| Minimum | 5.2% | 1.6% |
| Maximum | 18.7% | 22.3% |
| Range | 13.5% | 20.7% |
| Mean | 10.7% | 10.6% |
| Median | 10.8% | 9.5% |
| Interquartile 25% (IQ1) | 9.4% | 7.7% |
| Interquartile 75% (IQ3) | 11.6% | 11.6% |
| Interquartile Range (IQR) | 2.3% | 3.9% |
| Standard Deviation (Sample) | 2.6% | 4.7% |
| Standard Deviation (Population) | 2.6% | 4.7% |
Similar Demographics by Disability
Demographics Similar to Immigrants from Cameroon by Disability
In terms of disability, the demographic groups most similar to Immigrants from Cameroon are Sierra Leonean (11.0%, a difference of 0.040%), Immigrants from Belgium (11.0%, a difference of 0.040%), Immigrants from Jordan (11.1%, a difference of 0.040%), Immigrants from Vietnam (11.0%, a difference of 0.070%), and Immigrants from Ireland (11.1%, a difference of 0.080%).
| Demographics | Rating | Rank | Disability |
| Immigrants | Lebanon | 99.4 /100 | #71 | Exceptional 11.0% |
| Immigrants | Chile | 99.4 /100 | #72 | Exceptional 11.0% |
| Immigrants | Bangladesh | 99.4 /100 | #73 | Exceptional 11.0% |
| Immigrants | Serbia | 99.4 /100 | #74 | Exceptional 11.0% |
| Immigrants | Vietnam | 99.4 /100 | #75 | Exceptional 11.0% |
| Sierra Leoneans | 99.3 /100 | #76 | Exceptional 11.0% |
| Immigrants | Belgium | 99.3 /100 | #77 | Exceptional 11.0% |
| Immigrants | Cameroon | 99.3 /100 | #78 | Exceptional 11.1% |
| Immigrants | Jordan | 99.3 /100 | #79 | Exceptional 11.1% |
| Immigrants | Ireland | 99.3 /100 | #80 | Exceptional 11.1% |
| Immigrants | Poland | 99.1 /100 | #81 | Exceptional 11.1% |
| Chileans | 99.1 /100 | #82 | Exceptional 11.1% |
| Immigrants | Switzerland | 99.0 /100 | #83 | Exceptional 11.1% |
| Immigrants | Sierra Leone | 99.0 /100 | #84 | Exceptional 11.1% |
| Immigrants | Belarus | 98.9 /100 | #85 | Exceptional 11.1% |
Demographics Similar to Immigrants from Singapore by Disability
In terms of disability, the demographic groups most similar to Immigrants from Singapore are Bolivian (10.0%, a difference of 0.23%), Immigrants from South Central Asia (9.9%, a difference of 0.31%), Immigrants from Hong Kong (10.0%, a difference of 0.52%), Immigrants from Bolivia (9.9%, a difference of 1.2%), and Immigrants from China (10.1%, a difference of 1.3%).
| Demographics | Rating | Rank | Disability |
| Immigrants | India | 100.0 /100 | #1 | Exceptional 9.5% |
| Filipinos | 100.0 /100 | #2 | Exceptional 9.6% |
| Immigrants | Taiwan | 100.0 /100 | #3 | Exceptional 9.6% |
| Thais | 100.0 /100 | #4 | Exceptional 9.7% |
| Immigrants | Bolivia | 100.0 /100 | #5 | Exceptional 9.9% |
| Immigrants | South Central Asia | 100.0 /100 | #6 | Exceptional 9.9% |
| Immigrants | Singapore | 100.0 /100 | #7 | Exceptional 10.0% |
| Bolivians | 100.0 /100 | #8 | Exceptional 10.0% |
| Immigrants | Hong Kong | 100.0 /100 | #9 | Exceptional 10.0% |
| Immigrants | China | 100.0 /100 | #10 | Exceptional 10.1% |
| Iranians | 100.0 /100 | #11 | Exceptional 10.1% |
| Immigrants | Israel | 100.0 /100 | #12 | Exceptional 10.1% |
| Immigrants | Eastern Asia | 100.0 /100 | #13 | Exceptional 10.2% |
| Immigrants | Korea | 100.0 /100 | #14 | Exceptional 10.2% |
| Okinawans | 100.0 /100 | #15 | Exceptional 10.3% |