Immigrants from Cabo Verde vs Samoan Female Disability
COMPARE
Immigrants from Cabo Verde
Samoan
Female Disability
Female Disability Comparison
Immigrants from Cabo Verde
Samoans
14.6%
FEMALE DISABILITY
0.0/ 100
METRIC RATING
331st/ 347
METRIC RANK
12.4%
FEMALE DISABILITY
13.4/ 100
METRIC RATING
215th/ 347
METRIC RANK
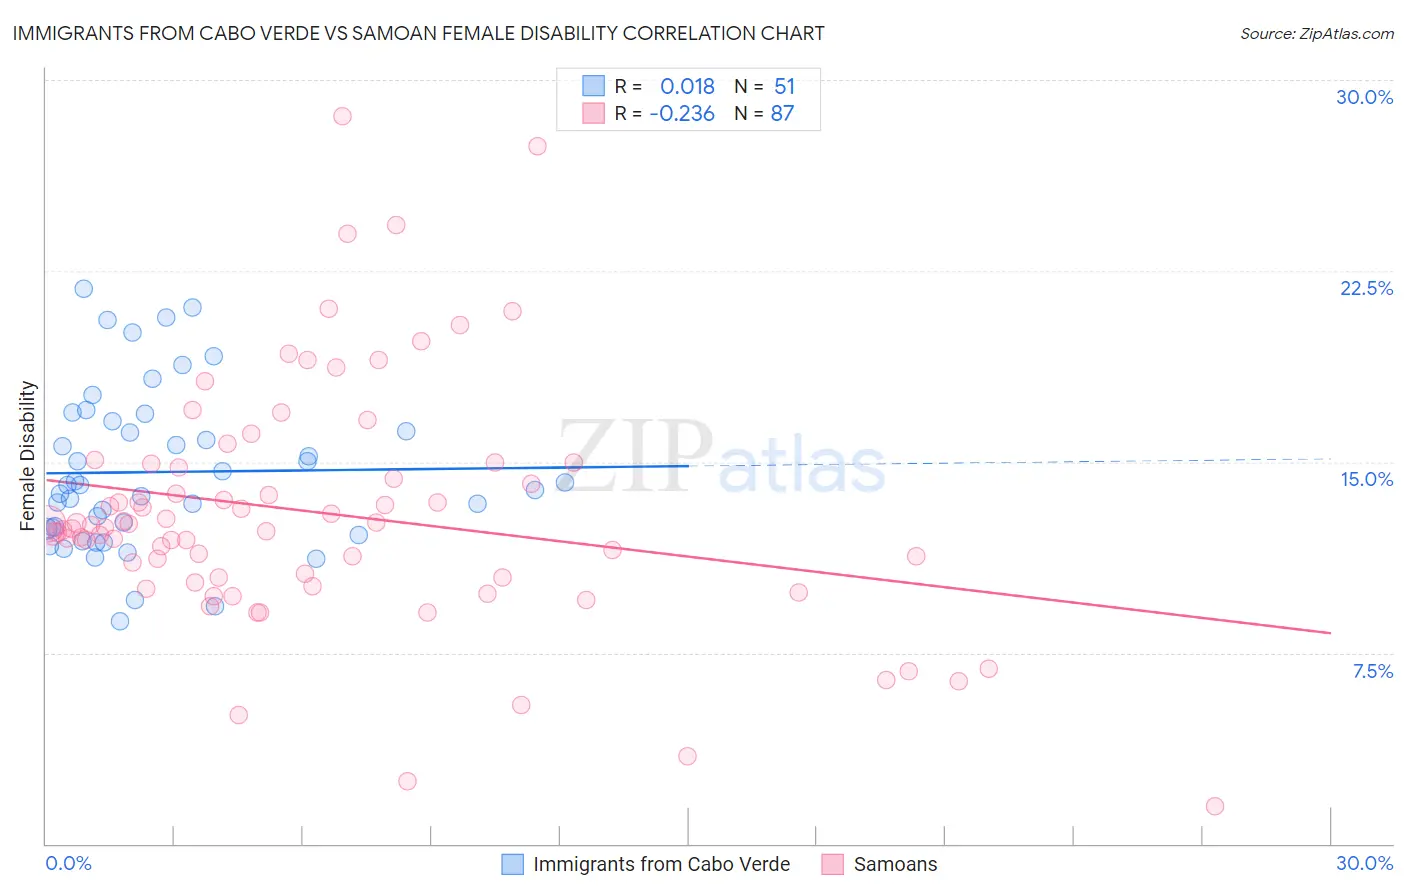
Immigrants from Cabo Verde vs Samoan Female Disability Correlation Chart
The statistical analysis conducted on geographies consisting of 38,139,523 people shows no correlation between the proportion of Immigrants from Cabo Verde and percentage of females with a disability in the United States with a correlation coefficient (R) of 0.018 and weighted average of 14.6%. Similarly, the statistical analysis conducted on geographies consisting of 225,122,232 people shows a weak negative correlation between the proportion of Samoans and percentage of females with a disability in the United States with a correlation coefficient (R) of -0.236 and weighted average of 12.4%, a difference of 17.3%.
Female Disability Correlation Summary
| Measurement | Immigrants from Cabo Verde | Samoan |
| Minimum | 8.7% | 1.5% |
| Maximum | 21.8% | 28.6% |
| Range | 13.1% | 27.1% |
| Mean | 14.6% | 13.0% |
| Median | 14.1% | 12.4% |
| Interquartile 25% (IQ1) | 12.4% | 10.4% |
| Interquartile 75% (IQ3) | 16.6% | 14.9% |
| Interquartile Range (IQR) | 4.2% | 4.5% |
| Standard Deviation (Sample) | 3.1% | 4.8% |
| Standard Deviation (Population) | 3.1% | 4.8% |
Similar Demographics by Female Disability
Demographics Similar to Immigrants from Cabo Verde by Female Disability
In terms of female disability, the demographic groups most similar to Immigrants from Cabo Verde are Yuman (14.5%, a difference of 0.42%), Pima (14.8%, a difference of 1.6%), Osage (14.3%, a difference of 1.8%), Immigrants from the Azores (14.9%, a difference of 2.0%), and Cherokee (14.9%, a difference of 2.1%).
| Demographics | Rating | Rank | Female Disability |
| Natives/Alaskans | 0.0 /100 | #324 | Tragic 14.1% |
| Navajo | 0.0 /100 | #325 | Tragic 14.2% |
| Comanche | 0.0 /100 | #326 | Tragic 14.2% |
| Ottawa | 0.0 /100 | #327 | Tragic 14.2% |
| Cape Verdeans | 0.0 /100 | #328 | Tragic 14.2% |
| Osage | 0.0 /100 | #329 | Tragic 14.3% |
| Yuman | 0.0 /100 | #330 | Tragic 14.5% |
| Immigrants | Cabo Verde | 0.0 /100 | #331 | Tragic 14.6% |
| Pima | 0.0 /100 | #332 | Tragic 14.8% |
| Immigrants | Azores | 0.0 /100 | #333 | Tragic 14.9% |
| Cherokee | 0.0 /100 | #334 | Tragic 14.9% |
| Cajuns | 0.0 /100 | #335 | Tragic 14.9% |
| Seminole | 0.0 /100 | #336 | Tragic 15.0% |
| Tohono O'odham | 0.0 /100 | #337 | Tragic 15.0% |
| Dutch West Indians | 0.0 /100 | #338 | Tragic 15.0% |
Demographics Similar to Samoans by Female Disability
In terms of female disability, the demographic groups most similar to Samoans are Panamanian (12.4%, a difference of 0.0%), Immigrants from Burma/Myanmar (12.4%, a difference of 0.010%), British (12.4%, a difference of 0.060%), Immigrants from Thailand (12.4%, a difference of 0.080%), and Immigrants from Bahamas (12.4%, a difference of 0.080%).
| Demographics | Rating | Rank | Female Disability |
| Basques | 17.5 /100 | #208 | Poor 12.4% |
| Mexicans | 15.7 /100 | #209 | Poor 12.4% |
| Swiss | 14.9 /100 | #210 | Poor 12.4% |
| Immigrants | Bosnia and Herzegovina | 14.8 /100 | #211 | Poor 12.4% |
| Ute | 14.7 /100 | #212 | Poor 12.4% |
| Immigrants | Thailand | 14.5 /100 | #213 | Poor 12.4% |
| Panamanians | 13.5 /100 | #214 | Poor 12.4% |
| Samoans | 13.4 /100 | #215 | Poor 12.4% |
| Immigrants | Burma/Myanmar | 13.3 /100 | #216 | Poor 12.4% |
| British | 12.7 /100 | #217 | Poor 12.4% |
| Immigrants | Bahamas | 12.5 /100 | #218 | Poor 12.4% |
| Europeans | 12.1 /100 | #219 | Poor 12.4% |
| Bahamians | 11.1 /100 | #220 | Poor 12.4% |
| Native Hawaiians | 10.8 /100 | #221 | Poor 12.4% |
| Italians | 10.7 /100 | #222 | Poor 12.4% |