Immigrants from Brazil vs Pima Cognitive Disability
COMPARE
Immigrants from Brazil
Pima
Cognitive Disability
Cognitive Disability Comparison
Immigrants from Brazil
Pima
17.0%
COGNITIVE DISABILITY
89.3/ 100
METRIC RATING
144th/ 347
METRIC RANK
18.8%
COGNITIVE DISABILITY
0.0/ 100
METRIC RATING
331st/ 347
METRIC RANK
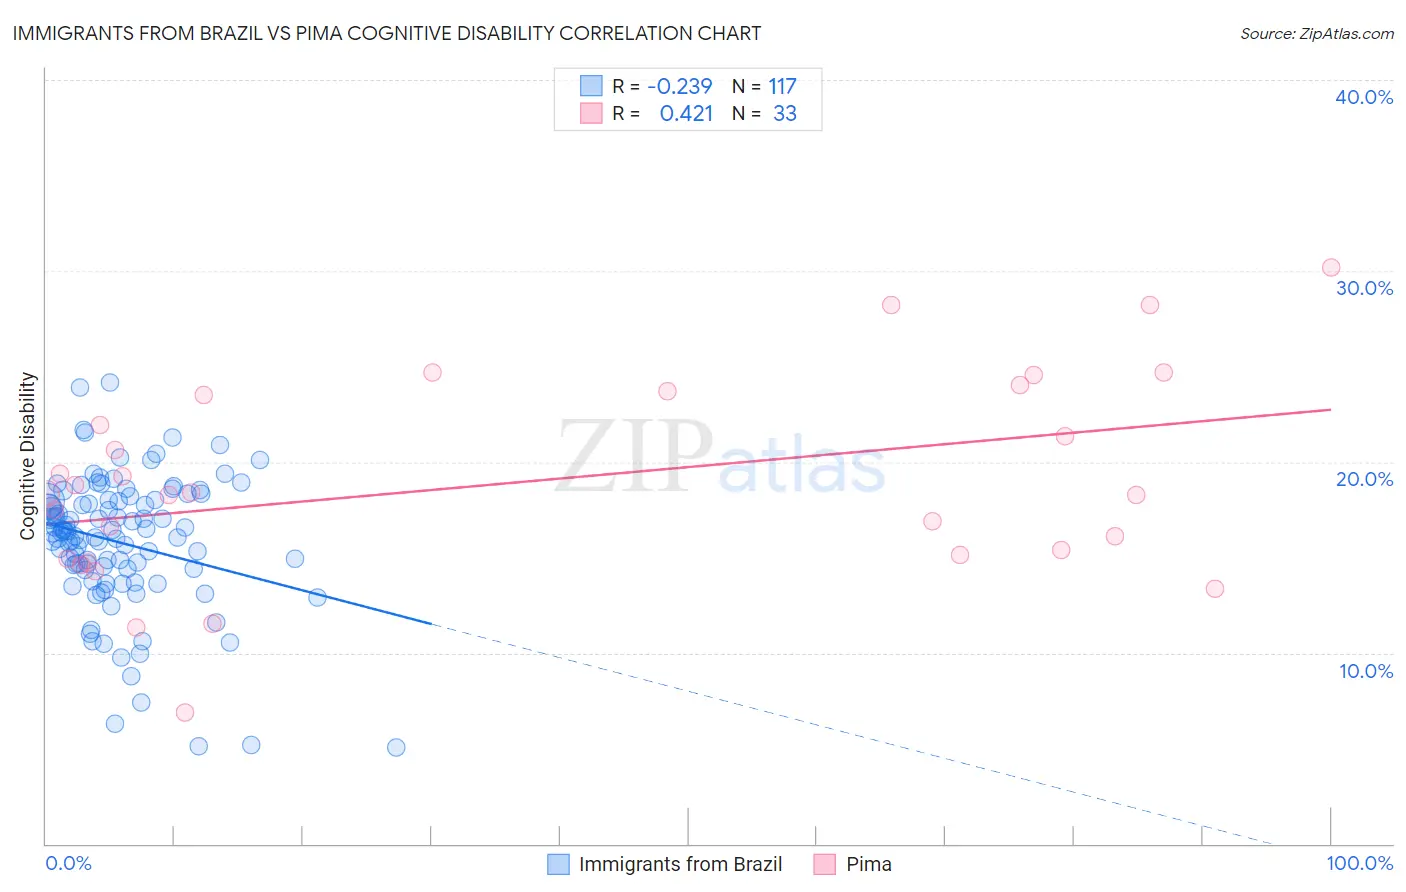
Immigrants from Brazil vs Pima Cognitive Disability Correlation Chart
The statistical analysis conducted on geographies consisting of 343,010,044 people shows a weak negative correlation between the proportion of Immigrants from Brazil and percentage of population with cognitive disability in the United States with a correlation coefficient (R) of -0.239 and weighted average of 17.0%. Similarly, the statistical analysis conducted on geographies consisting of 61,542,171 people shows a moderate positive correlation between the proportion of Pima and percentage of population with cognitive disability in the United States with a correlation coefficient (R) of 0.421 and weighted average of 18.8%, a difference of 10.4%.
Cognitive Disability Correlation Summary
| Measurement | Immigrants from Brazil | Pima |
| Minimum | 5.1% | 6.9% |
| Maximum | 24.2% | 30.2% |
| Range | 19.1% | 23.3% |
| Mean | 15.8% | 19.0% |
| Median | 16.3% | 18.4% |
| Interquartile 25% (IQ1) | 14.4% | 15.0% |
| Interquartile 75% (IQ3) | 18.0% | 23.6% |
| Interquartile Range (IQR) | 3.6% | 8.6% |
| Standard Deviation (Sample) | 3.5% | 5.3% |
| Standard Deviation (Population) | 3.5% | 5.2% |
Similar Demographics by Cognitive Disability
Demographics Similar to Immigrants from Brazil by Cognitive Disability
In terms of cognitive disability, the demographic groups most similar to Immigrants from Brazil are British (17.0%, a difference of 0.0%), Carpatho Rusyn (17.0%, a difference of 0.020%), French (17.0%, a difference of 0.050%), Chilean (17.0%, a difference of 0.050%), and Aleut (17.0%, a difference of 0.050%).
| Demographics | Rating | Rank | Cognitive Disability |
| Immigrants | Norway | 90.9 /100 | #137 | Exceptional 17.0% |
| Welsh | 90.8 /100 | #138 | Exceptional 17.0% |
| French | 90.0 /100 | #139 | Excellent 17.0% |
| Chileans | 89.9 /100 | #140 | Excellent 17.0% |
| Aleuts | 89.9 /100 | #141 | Excellent 17.0% |
| Carpatho Rusyns | 89.6 /100 | #142 | Excellent 17.0% |
| British | 89.3 /100 | #143 | Excellent 17.0% |
| Immigrants | Brazil | 89.3 /100 | #144 | Excellent 17.0% |
| Immigrants | South Eastern Asia | 88.7 /100 | #145 | Excellent 17.0% |
| Costa Ricans | 88.0 /100 | #146 | Excellent 17.0% |
| Scotch-Irish | 85.9 /100 | #147 | Excellent 17.1% |
| French Canadians | 85.7 /100 | #148 | Excellent 17.1% |
| Cypriots | 85.7 /100 | #149 | Excellent 17.1% |
| Basques | 85.5 /100 | #150 | Excellent 17.1% |
| Syrians | 83.0 /100 | #151 | Excellent 17.1% |
Demographics Similar to Pima by Cognitive Disability
In terms of cognitive disability, the demographic groups most similar to Pima are Immigrants from Sudan (18.8%, a difference of 0.020%), Immigrants from Dominican Republic (18.8%, a difference of 0.070%), Immigrants from Yemen (18.8%, a difference of 0.070%), Navajo (18.8%, a difference of 0.16%), and Kiowa (18.7%, a difference of 0.39%).
| Demographics | Rating | Rank | Cognitive Disability |
| Dominicans | 0.0 /100 | #324 | Tragic 18.7% |
| Indonesians | 0.0 /100 | #325 | Tragic 18.7% |
| Immigrants | Senegal | 0.0 /100 | #326 | Tragic 18.7% |
| U.S. Virgin Islanders | 0.0 /100 | #327 | Tragic 18.7% |
| Kiowa | 0.0 /100 | #328 | Tragic 18.7% |
| Navajo | 0.0 /100 | #329 | Tragic 18.8% |
| Immigrants | Dominican Republic | 0.0 /100 | #330 | Tragic 18.8% |
| Pima | 0.0 /100 | #331 | Tragic 18.8% |
| Immigrants | Sudan | 0.0 /100 | #332 | Tragic 18.8% |
| Immigrants | Yemen | 0.0 /100 | #333 | Tragic 18.8% |
| Sudanese | 0.0 /100 | #334 | Tragic 18.9% |
| Senegalese | 0.0 /100 | #335 | Tragic 19.0% |
| Blacks/African Americans | 0.0 /100 | #336 | Tragic 19.0% |
| Immigrants | Saudi Arabia | 0.0 /100 | #337 | Tragic 19.1% |
| Lumbee | 0.0 /100 | #338 | Tragic 19.1% |