Immigrants from Europe vs Pima Cognitive Disability
COMPARE
Immigrants from Europe
Pima
Cognitive Disability
Cognitive Disability Comparison
Immigrants from Europe
Pima
16.5%
COGNITIVE DISABILITY
99.8/ 100
METRIC RATING
45th/ 347
METRIC RANK
18.8%
COGNITIVE DISABILITY
0.0/ 100
METRIC RATING
331st/ 347
METRIC RANK
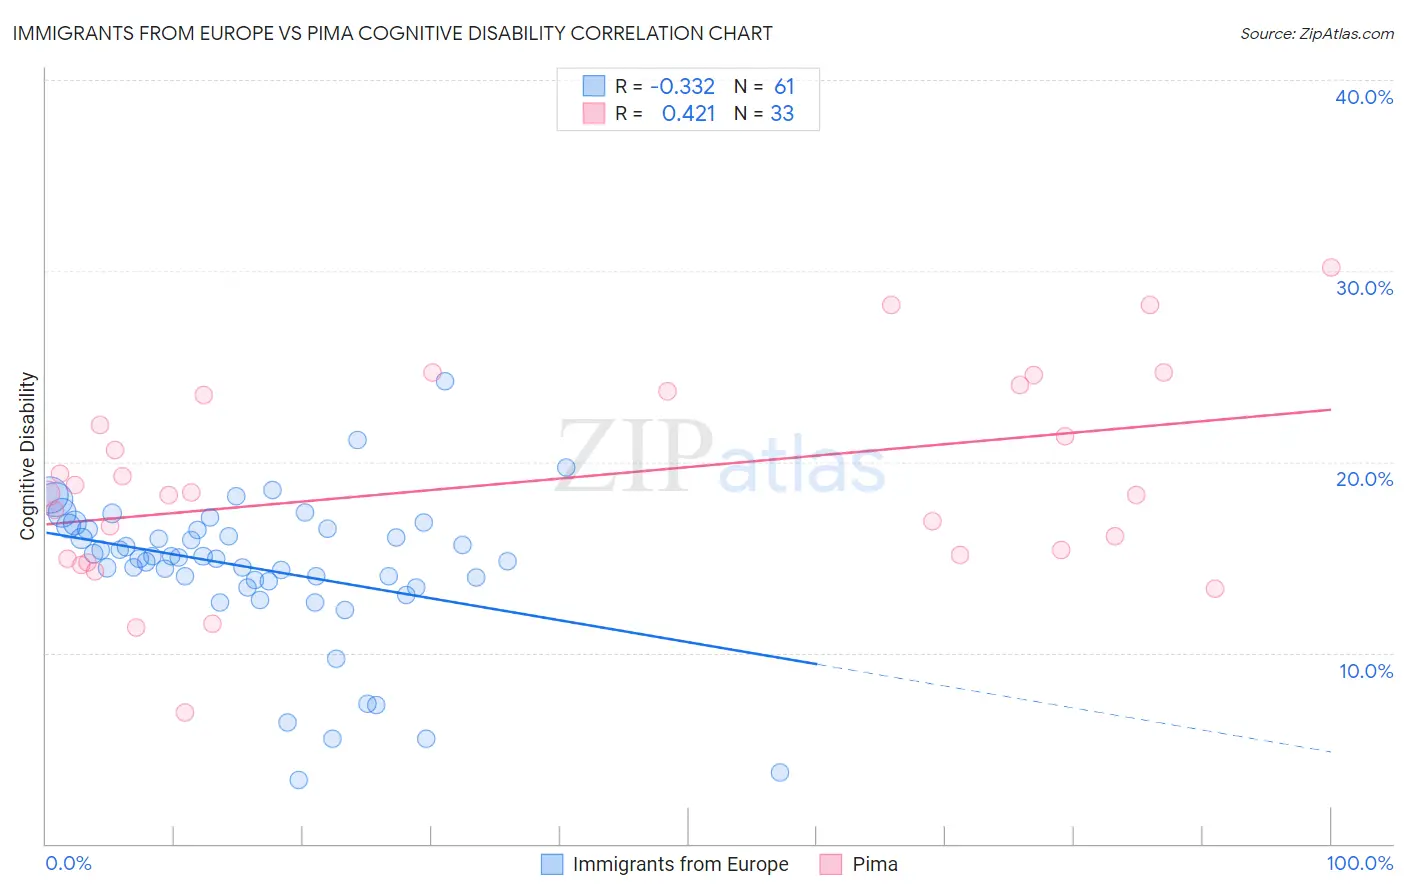
Immigrants from Europe vs Pima Cognitive Disability Correlation Chart
The statistical analysis conducted on geographies consisting of 547,313,932 people shows a mild negative correlation between the proportion of Immigrants from Europe and percentage of population with cognitive disability in the United States with a correlation coefficient (R) of -0.332 and weighted average of 16.5%. Similarly, the statistical analysis conducted on geographies consisting of 61,542,171 people shows a moderate positive correlation between the proportion of Pima and percentage of population with cognitive disability in the United States with a correlation coefficient (R) of 0.421 and weighted average of 18.8%, a difference of 14.0%.
Cognitive Disability Correlation Summary
| Measurement | Immigrants from Europe | Pima |
| Minimum | 3.3% | 6.9% |
| Maximum | 24.2% | 30.2% |
| Range | 20.9% | 23.3% |
| Mean | 14.4% | 19.0% |
| Median | 15.0% | 18.4% |
| Interquartile 25% (IQ1) | 13.6% | 15.0% |
| Interquartile 75% (IQ3) | 16.5% | 23.6% |
| Interquartile Range (IQR) | 2.9% | 8.6% |
| Standard Deviation (Sample) | 3.9% | 5.3% |
| Standard Deviation (Population) | 3.9% | 5.2% |
Similar Demographics by Cognitive Disability
Demographics Similar to Immigrants from Europe by Cognitive Disability
In terms of cognitive disability, the demographic groups most similar to Immigrants from Europe are Macedonian (16.5%, a difference of 0.010%), Immigrants from Colombia (16.5%, a difference of 0.010%), Immigrants from Canada (16.5%, a difference of 0.030%), Immigrants from Italy (16.5%, a difference of 0.040%), and Immigrants from North America (16.5%, a difference of 0.040%).
| Demographics | Rating | Rank | Cognitive Disability |
| Immigrants | Eastern Europe | 99.9 /100 | #38 | Exceptional 16.5% |
| Bolivians | 99.9 /100 | #39 | Exceptional 16.5% |
| Immigrants | Belarus | 99.9 /100 | #40 | Exceptional 16.5% |
| Cubans | 99.9 /100 | #41 | Exceptional 16.5% |
| Hungarians | 99.9 /100 | #42 | Exceptional 16.5% |
| Immigrants | Canada | 99.8 /100 | #43 | Exceptional 16.5% |
| Macedonians | 99.8 /100 | #44 | Exceptional 16.5% |
| Immigrants | Europe | 99.8 /100 | #45 | Exceptional 16.5% |
| Immigrants | Colombia | 99.8 /100 | #46 | Exceptional 16.5% |
| Immigrants | Italy | 99.8 /100 | #47 | Exceptional 16.5% |
| Immigrants | North America | 99.8 /100 | #48 | Exceptional 16.5% |
| Iranians | 99.8 /100 | #49 | Exceptional 16.5% |
| Norwegians | 99.8 /100 | #50 | Exceptional 16.5% |
| Immigrants | Korea | 99.8 /100 | #51 | Exceptional 16.5% |
| Soviet Union | 99.8 /100 | #52 | Exceptional 16.5% |
Demographics Similar to Pima by Cognitive Disability
In terms of cognitive disability, the demographic groups most similar to Pima are Immigrants from Sudan (18.8%, a difference of 0.020%), Immigrants from Dominican Republic (18.8%, a difference of 0.070%), Immigrants from Yemen (18.8%, a difference of 0.070%), Navajo (18.8%, a difference of 0.16%), and Kiowa (18.7%, a difference of 0.39%).
| Demographics | Rating | Rank | Cognitive Disability |
| Dominicans | 0.0 /100 | #324 | Tragic 18.7% |
| Indonesians | 0.0 /100 | #325 | Tragic 18.7% |
| Immigrants | Senegal | 0.0 /100 | #326 | Tragic 18.7% |
| U.S. Virgin Islanders | 0.0 /100 | #327 | Tragic 18.7% |
| Kiowa | 0.0 /100 | #328 | Tragic 18.7% |
| Navajo | 0.0 /100 | #329 | Tragic 18.8% |
| Immigrants | Dominican Republic | 0.0 /100 | #330 | Tragic 18.8% |
| Pima | 0.0 /100 | #331 | Tragic 18.8% |
| Immigrants | Sudan | 0.0 /100 | #332 | Tragic 18.8% |
| Immigrants | Yemen | 0.0 /100 | #333 | Tragic 18.8% |
| Sudanese | 0.0 /100 | #334 | Tragic 18.9% |
| Senegalese | 0.0 /100 | #335 | Tragic 19.0% |
| Blacks/African Americans | 0.0 /100 | #336 | Tragic 19.0% |
| Immigrants | Saudi Arabia | 0.0 /100 | #337 | Tragic 19.1% |
| Lumbee | 0.0 /100 | #338 | Tragic 19.1% |