Immigrants from Brazil vs Immigrants from Zaire Cognitive Disability
COMPARE
Immigrants from Brazil
Immigrants from Zaire
Cognitive Disability
Cognitive Disability Comparison
Immigrants from Brazil
Immigrants from Zaire
17.0%
COGNITIVE DISABILITY
89.3/ 100
METRIC RATING
144th/ 347
METRIC RANK
19.4%
COGNITIVE DISABILITY
0.0/ 100
METRIC RATING
343rd/ 347
METRIC RANK
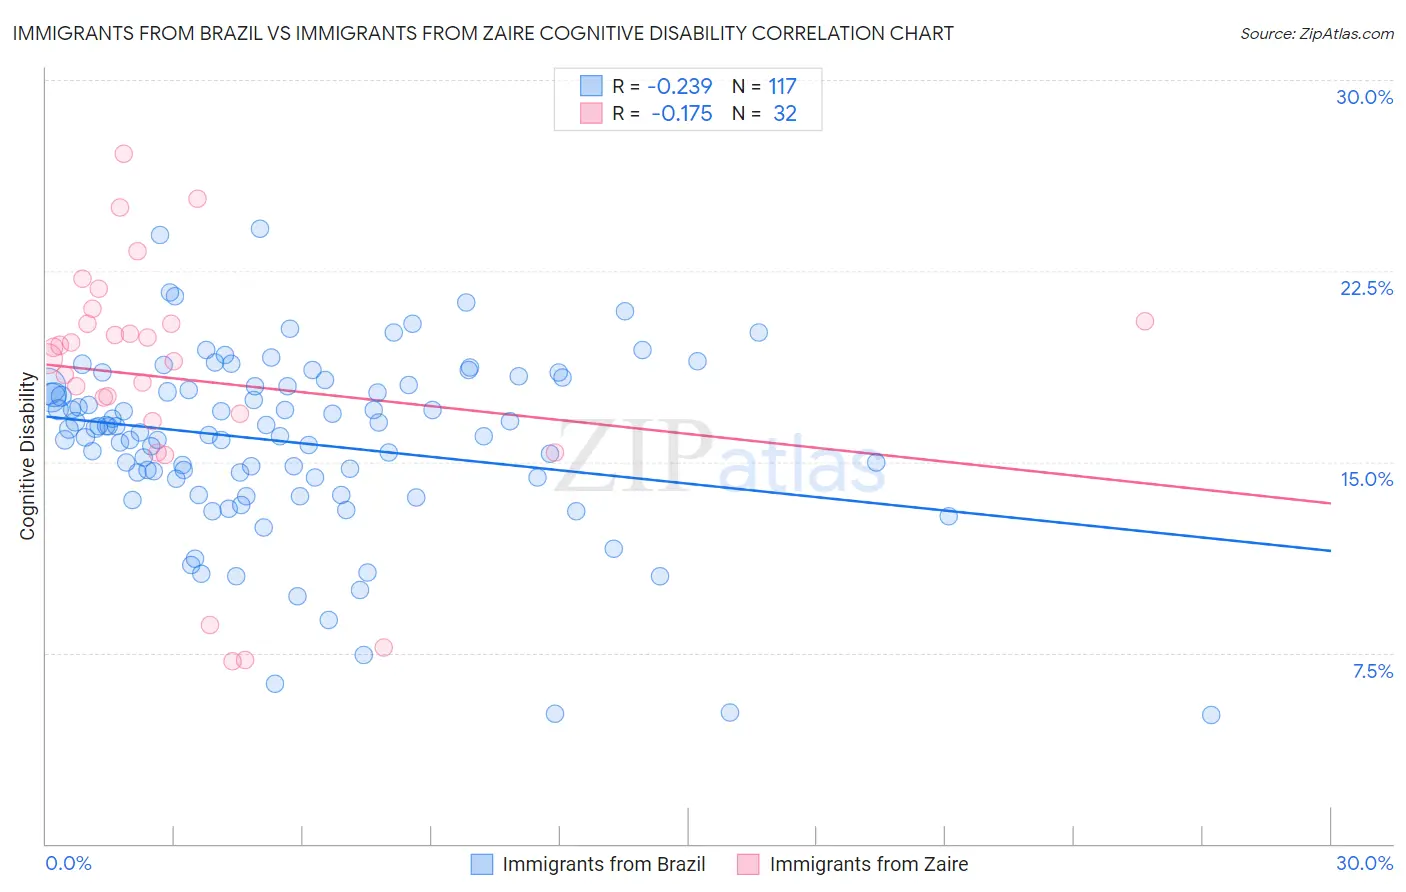
Immigrants from Brazil vs Immigrants from Zaire Cognitive Disability Correlation Chart
The statistical analysis conducted on geographies consisting of 343,010,044 people shows a weak negative correlation between the proportion of Immigrants from Brazil and percentage of population with cognitive disability in the United States with a correlation coefficient (R) of -0.239 and weighted average of 17.0%. Similarly, the statistical analysis conducted on geographies consisting of 107,255,223 people shows a poor negative correlation between the proportion of Immigrants from Zaire and percentage of population with cognitive disability in the United States with a correlation coefficient (R) of -0.175 and weighted average of 19.4%, a difference of 14.0%.
Cognitive Disability Correlation Summary
| Measurement | Immigrants from Brazil | Immigrants from Zaire |
| Minimum | 5.1% | 7.2% |
| Maximum | 24.2% | 27.1% |
| Range | 19.1% | 19.9% |
| Mean | 15.8% | 18.2% |
| Median | 16.3% | 19.3% |
| Interquartile 25% (IQ1) | 14.4% | 16.8% |
| Interquartile 75% (IQ3) | 18.0% | 20.5% |
| Interquartile Range (IQR) | 3.6% | 3.7% |
| Standard Deviation (Sample) | 3.5% | 4.9% |
| Standard Deviation (Population) | 3.5% | 4.8% |
Similar Demographics by Cognitive Disability
Demographics Similar to Immigrants from Brazil by Cognitive Disability
In terms of cognitive disability, the demographic groups most similar to Immigrants from Brazil are British (17.0%, a difference of 0.0%), Carpatho Rusyn (17.0%, a difference of 0.020%), French (17.0%, a difference of 0.050%), Chilean (17.0%, a difference of 0.050%), and Aleut (17.0%, a difference of 0.050%).
| Demographics | Rating | Rank | Cognitive Disability |
| Immigrants | Norway | 90.9 /100 | #137 | Exceptional 17.0% |
| Welsh | 90.8 /100 | #138 | Exceptional 17.0% |
| French | 90.0 /100 | #139 | Excellent 17.0% |
| Chileans | 89.9 /100 | #140 | Excellent 17.0% |
| Aleuts | 89.9 /100 | #141 | Excellent 17.0% |
| Carpatho Rusyns | 89.6 /100 | #142 | Excellent 17.0% |
| British | 89.3 /100 | #143 | Excellent 17.0% |
| Immigrants | Brazil | 89.3 /100 | #144 | Excellent 17.0% |
| Immigrants | South Eastern Asia | 88.7 /100 | #145 | Excellent 17.0% |
| Costa Ricans | 88.0 /100 | #146 | Excellent 17.0% |
| Scotch-Irish | 85.9 /100 | #147 | Excellent 17.1% |
| French Canadians | 85.7 /100 | #148 | Excellent 17.1% |
| Cypriots | 85.7 /100 | #149 | Excellent 17.1% |
| Basques | 85.5 /100 | #150 | Excellent 17.1% |
| Syrians | 83.0 /100 | #151 | Excellent 17.1% |
Demographics Similar to Immigrants from Zaire by Cognitive Disability
In terms of cognitive disability, the demographic groups most similar to Immigrants from Zaire are Tohono O'odham (19.3%, a difference of 0.69%), Houma (19.3%, a difference of 0.69%), Cape Verdean (19.2%, a difference of 0.93%), Puerto Rican (19.2%, a difference of 0.96%), and Lumbee (19.1%, a difference of 1.4%).
| Demographics | Rating | Rank | Cognitive Disability |
| Immigrants | Yemen | 0.0 /100 | #333 | Tragic 18.8% |
| Sudanese | 0.0 /100 | #334 | Tragic 18.9% |
| Senegalese | 0.0 /100 | #335 | Tragic 19.0% |
| Blacks/African Americans | 0.0 /100 | #336 | Tragic 19.0% |
| Immigrants | Saudi Arabia | 0.0 /100 | #337 | Tragic 19.1% |
| Lumbee | 0.0 /100 | #338 | Tragic 19.1% |
| Puerto Ricans | 0.0 /100 | #339 | Tragic 19.2% |
| Cape Verdeans | 0.0 /100 | #340 | Tragic 19.2% |
| Tohono O'odham | 0.0 /100 | #341 | Tragic 19.3% |
| Houma | 0.0 /100 | #342 | Tragic 19.3% |
| Immigrants | Zaire | 0.0 /100 | #343 | Tragic 19.4% |
| Immigrants | Congo | 0.0 /100 | #344 | Tragic 19.7% |
| Somalis | 0.0 /100 | #345 | Tragic 19.8% |
| Immigrants | Cabo Verde | 0.0 /100 | #346 | Tragic 19.9% |
| Immigrants | Somalia | 0.0 /100 | #347 | Tragic 20.0% |