Immigrants from the Azores vs Belizean Female Disability
COMPARE
Immigrants from the Azores
Belizean
Female Disability
Female Disability Comparison
Immigrants from the Azores
Belizeans
14.9%
FEMALE DISABILITY
0.0/ 100
METRIC RATING
333rd/ 347
METRIC RANK
12.5%
FEMALE DISABILITY
9.3/ 100
METRIC RATING
224th/ 347
METRIC RANK
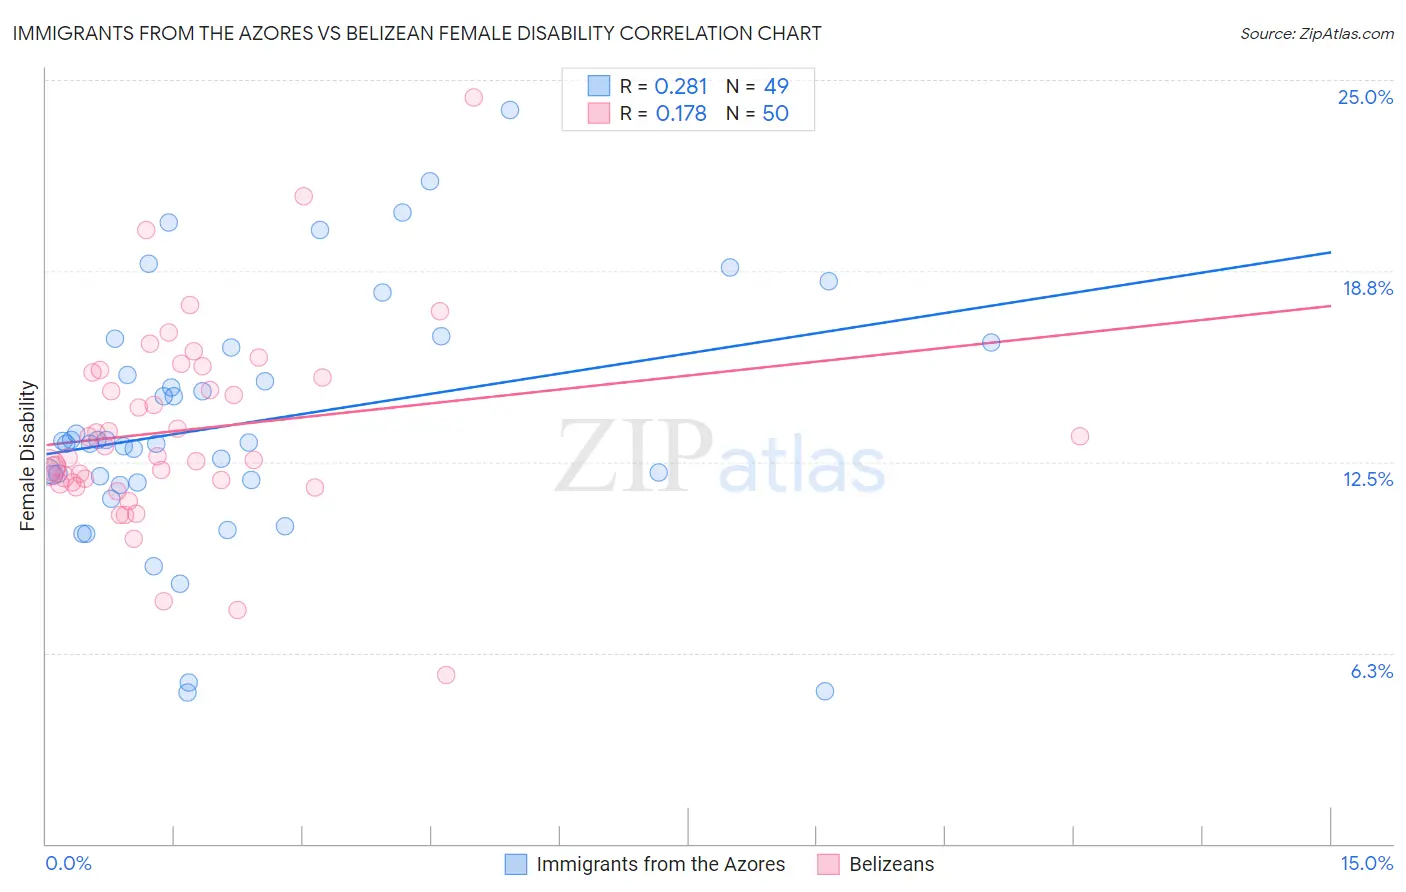
Immigrants from the Azores vs Belizean Female Disability Correlation Chart
The statistical analysis conducted on geographies consisting of 46,257,310 people shows a weak positive correlation between the proportion of Immigrants from the Azores and percentage of females with a disability in the United States with a correlation coefficient (R) of 0.281 and weighted average of 14.9%. Similarly, the statistical analysis conducted on geographies consisting of 144,186,476 people shows a poor positive correlation between the proportion of Belizeans and percentage of females with a disability in the United States with a correlation coefficient (R) of 0.178 and weighted average of 12.5%, a difference of 19.2%.
Female Disability Correlation Summary
| Measurement | Immigrants from the Azores | Belizean |
| Minimum | 5.0% | 5.5% |
| Maximum | 24.0% | 24.4% |
| Range | 19.1% | 18.9% |
| Mean | 13.8% | 13.5% |
| Median | 13.1% | 12.8% |
| Interquartile 25% (IQ1) | 11.9% | 11.8% |
| Interquartile 75% (IQ3) | 16.3% | 15.4% |
| Interquartile Range (IQR) | 4.5% | 3.6% |
| Standard Deviation (Sample) | 4.1% | 3.2% |
| Standard Deviation (Population) | 4.0% | 3.2% |
Similar Demographics by Female Disability
Demographics Similar to Immigrants from the Azores by Female Disability
In terms of female disability, the demographic groups most similar to Immigrants from the Azores are Cherokee (14.9%, a difference of 0.090%), Cajun (14.9%, a difference of 0.11%), Pima (14.8%, a difference of 0.39%), Seminole (15.0%, a difference of 0.79%), and Tohono O'odham (15.0%, a difference of 0.91%).
| Demographics | Rating | Rank | Female Disability |
| Comanche | 0.0 /100 | #326 | Tragic 14.2% |
| Ottawa | 0.0 /100 | #327 | Tragic 14.2% |
| Cape Verdeans | 0.0 /100 | #328 | Tragic 14.2% |
| Osage | 0.0 /100 | #329 | Tragic 14.3% |
| Yuman | 0.0 /100 | #330 | Tragic 14.5% |
| Immigrants | Cabo Verde | 0.0 /100 | #331 | Tragic 14.6% |
| Pima | 0.0 /100 | #332 | Tragic 14.8% |
| Immigrants | Azores | 0.0 /100 | #333 | Tragic 14.9% |
| Cherokee | 0.0 /100 | #334 | Tragic 14.9% |
| Cajuns | 0.0 /100 | #335 | Tragic 14.9% |
| Seminole | 0.0 /100 | #336 | Tragic 15.0% |
| Tohono O'odham | 0.0 /100 | #337 | Tragic 15.0% |
| Dutch West Indians | 0.0 /100 | #338 | Tragic 15.0% |
| Colville | 0.0 /100 | #339 | Tragic 15.1% |
| Chickasaw | 0.0 /100 | #340 | Tragic 15.2% |
Demographics Similar to Belizeans by Female Disability
In terms of female disability, the demographic groups most similar to Belizeans are Guamanian/Chamorro (12.5%, a difference of 0.020%), Polish (12.5%, a difference of 0.10%), Italian (12.4%, a difference of 0.14%), Hispanic or Latino (12.5%, a difference of 0.15%), and Native Hawaiian (12.4%, a difference of 0.16%).
| Demographics | Rating | Rank | Female Disability |
| British | 12.7 /100 | #217 | Poor 12.4% |
| Immigrants | Bahamas | 12.5 /100 | #218 | Poor 12.4% |
| Europeans | 12.1 /100 | #219 | Poor 12.4% |
| Bahamians | 11.1 /100 | #220 | Poor 12.4% |
| Native Hawaiians | 10.8 /100 | #221 | Poor 12.4% |
| Italians | 10.7 /100 | #222 | Poor 12.4% |
| Guamanians/Chamorros | 9.5 /100 | #223 | Tragic 12.5% |
| Belizeans | 9.3 /100 | #224 | Tragic 12.5% |
| Poles | 8.4 /100 | #225 | Tragic 12.5% |
| Hispanics or Latinos | 8.0 /100 | #226 | Tragic 12.5% |
| Assyrians/Chaldeans/Syriacs | 8.0 /100 | #227 | Tragic 12.5% |
| Immigrants | Cambodia | 7.8 /100 | #228 | Tragic 12.5% |
| Hungarians | 7.2 /100 | #229 | Tragic 12.5% |
| Immigrants | Belize | 7.0 /100 | #230 | Tragic 12.5% |
| Belgians | 6.5 /100 | #231 | Tragic 12.5% |