Immigrants from Australia vs Thai Female Disability
COMPARE
Immigrants from Australia
Thai
Female Disability
Female Disability Comparison
Immigrants from Australia
Thais
11.1%
FEMALE DISABILITY
100.0/ 100
METRIC RATING
32nd/ 347
METRIC RANK
10.2%
FEMALE DISABILITY
100.0/ 100
METRIC RATING
4th/ 347
METRIC RANK
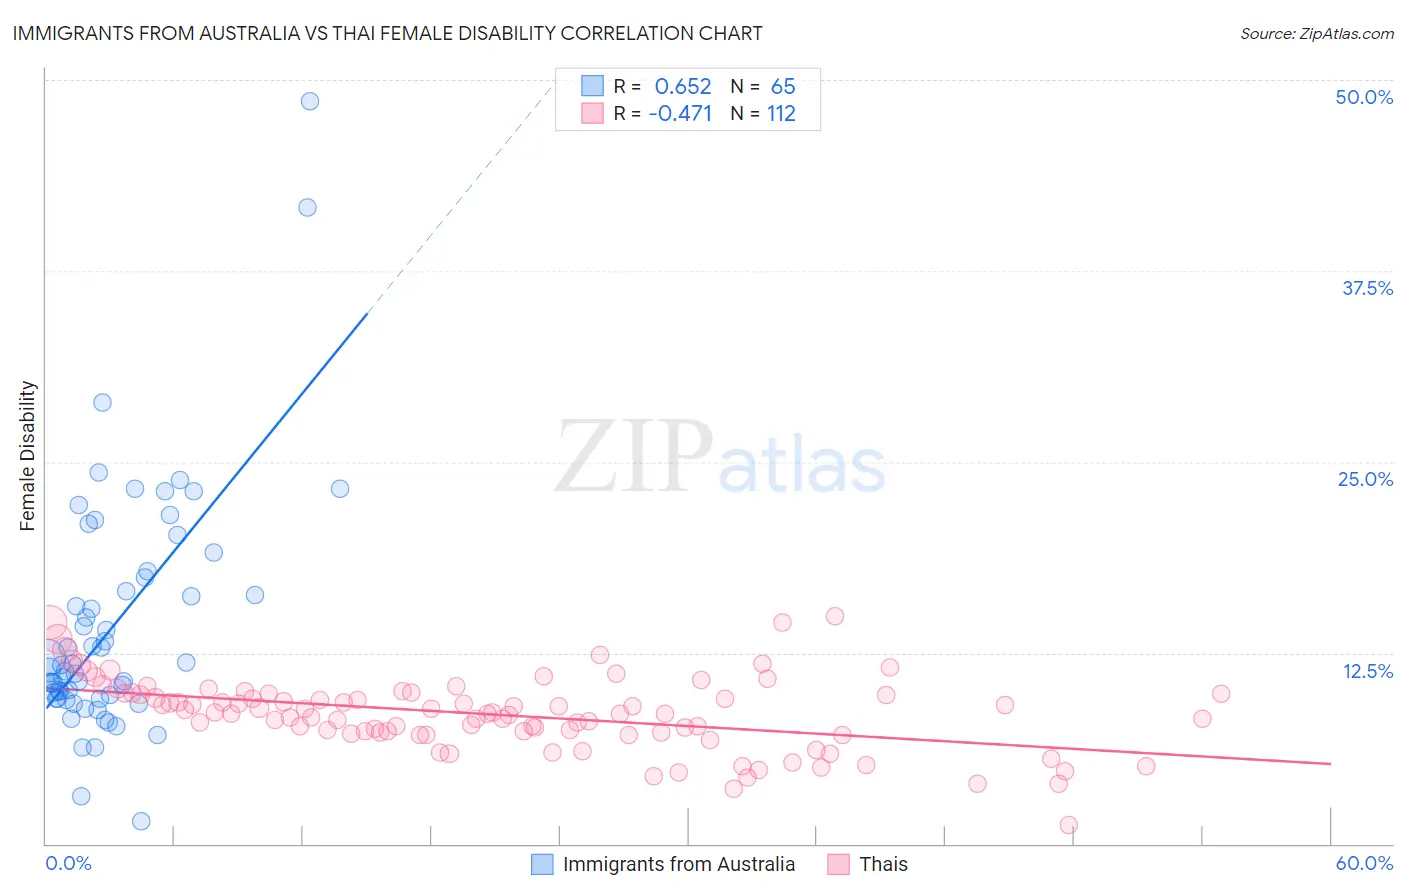
Immigrants from Australia vs Thai Female Disability Correlation Chart
The statistical analysis conducted on geographies consisting of 227,197,779 people shows a significant positive correlation between the proportion of Immigrants from Australia and percentage of females with a disability in the United States with a correlation coefficient (R) of 0.652 and weighted average of 11.1%. Similarly, the statistical analysis conducted on geographies consisting of 475,795,002 people shows a moderate negative correlation between the proportion of Thais and percentage of females with a disability in the United States with a correlation coefficient (R) of -0.471 and weighted average of 10.2%, a difference of 9.4%.
Female Disability Correlation Summary
| Measurement | Immigrants from Australia | Thai |
| Minimum | 1.4% | 1.2% |
| Maximum | 48.6% | 14.9% |
| Range | 47.1% | 13.7% |
| Mean | 14.3% | 8.5% |
| Median | 11.7% | 8.5% |
| Interquartile 25% (IQ1) | 9.5% | 7.3% |
| Interquartile 75% (IQ3) | 17.7% | 9.8% |
| Interquartile Range (IQR) | 8.1% | 2.5% |
| Standard Deviation (Sample) | 7.9% | 2.4% |
| Standard Deviation (Population) | 7.9% | 2.4% |
Similar Demographics by Female Disability
Demographics Similar to Immigrants from Australia by Female Disability
In terms of female disability, the demographic groups most similar to Immigrants from Australia are Immigrants from Egypt (11.1%, a difference of 0.080%), Immigrants from Kuwait (11.1%, a difference of 0.17%), Immigrants from Malaysia (11.1%, a difference of 0.27%), Turkish (11.1%, a difference of 0.27%), and Egyptian (11.1%, a difference of 0.33%).
| Demographics | Rating | Rank | Female Disability |
| Immigrants | Asia | 100.0 /100 | #25 | Exceptional 11.0% |
| Argentineans | 100.0 /100 | #26 | Exceptional 11.0% |
| Immigrants | Turkey | 100.0 /100 | #27 | Exceptional 11.1% |
| Egyptians | 100.0 /100 | #28 | Exceptional 11.1% |
| Immigrants | Malaysia | 100.0 /100 | #29 | Exceptional 11.1% |
| Turks | 100.0 /100 | #30 | Exceptional 11.1% |
| Immigrants | Kuwait | 100.0 /100 | #31 | Exceptional 11.1% |
| Immigrants | Australia | 100.0 /100 | #32 | Exceptional 11.1% |
| Immigrants | Egypt | 100.0 /100 | #33 | Exceptional 11.1% |
| Immigrants | Indonesia | 100.0 /100 | #34 | Exceptional 11.2% |
| Immigrants | Japan | 100.0 /100 | #35 | Exceptional 11.2% |
| Cypriots | 100.0 /100 | #36 | Exceptional 11.2% |
| Ethiopians | 100.0 /100 | #37 | Exceptional 11.2% |
| Immigrants | Ethiopia | 100.0 /100 | #38 | Exceptional 11.2% |
| Immigrants | Lithuania | 100.0 /100 | #39 | Exceptional 11.2% |
Demographics Similar to Thais by Female Disability
In terms of female disability, the demographic groups most similar to Thais are Immigrants from Bolivia (10.3%, a difference of 0.82%), Immigrants from Taiwan (10.1%, a difference of 0.88%), Filipino (10.1%, a difference of 1.1%), Bolivian (10.4%, a difference of 1.7%), and Immigrants from India (10.0%, a difference of 2.1%).
| Demographics | Rating | Rank | Female Disability |
| Immigrants | India | 100.0 /100 | #1 | Exceptional 10.0% |
| Filipinos | 100.0 /100 | #2 | Exceptional 10.1% |
| Immigrants | Taiwan | 100.0 /100 | #3 | Exceptional 10.1% |
| Thais | 100.0 /100 | #4 | Exceptional 10.2% |
| Immigrants | Bolivia | 100.0 /100 | #5 | Exceptional 10.3% |
| Bolivians | 100.0 /100 | #6 | Exceptional 10.4% |
| Immigrants | Singapore | 100.0 /100 | #7 | Exceptional 10.4% |
| Immigrants | South Central Asia | 100.0 /100 | #8 | Exceptional 10.5% |
| Iranians | 100.0 /100 | #9 | Exceptional 10.6% |
| Immigrants | Hong Kong | 100.0 /100 | #10 | Exceptional 10.6% |
| Immigrants | Korea | 100.0 /100 | #11 | Exceptional 10.6% |
| Immigrants | Israel | 100.0 /100 | #12 | Exceptional 10.7% |
| Immigrants | Eastern Asia | 100.0 /100 | #13 | Exceptional 10.7% |
| Immigrants | China | 100.0 /100 | #14 | Exceptional 10.7% |
| Burmese | 100.0 /100 | #15 | Exceptional 10.7% |