Immigrants from Australia vs Immigrants from India Hearing Disability
COMPARE
Immigrants from Australia
Immigrants from India
Hearing Disability
Hearing Disability Comparison
Immigrants from Australia
Immigrants from India
2.9%
HEARING DISABILITY
67.4/ 100
METRIC RATING
159th/ 347
METRIC RANK
2.5%
HEARING DISABILITY
99.9/ 100
METRIC RATING
17th/ 347
METRIC RANK
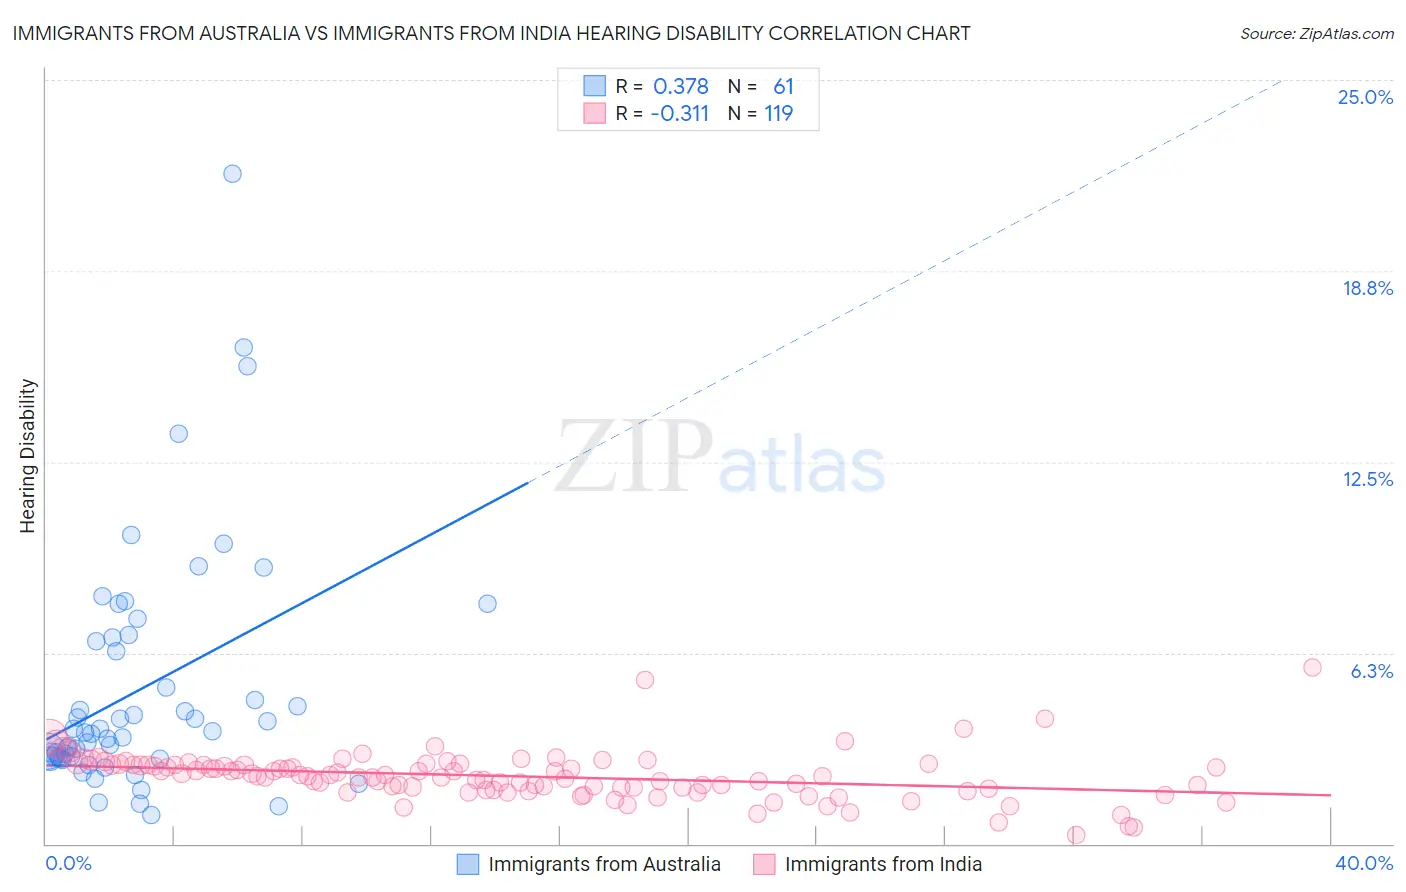
Immigrants from Australia vs Immigrants from India Hearing Disability Correlation Chart
The statistical analysis conducted on geographies consisting of 227,168,365 people shows a mild positive correlation between the proportion of Immigrants from Australia and percentage of population with hearing disability in the United States with a correlation coefficient (R) of 0.378 and weighted average of 2.9%. Similarly, the statistical analysis conducted on geographies consisting of 433,914,336 people shows a mild negative correlation between the proportion of Immigrants from India and percentage of population with hearing disability in the United States with a correlation coefficient (R) of -0.311 and weighted average of 2.5%, a difference of 16.4%.
Hearing Disability Correlation Summary
| Measurement | Immigrants from Australia | Immigrants from India |
| Minimum | 0.93% | 0.30% |
| Maximum | 21.9% | 5.8% |
| Range | 21.0% | 5.5% |
| Mean | 5.0% | 2.2% |
| Median | 3.6% | 2.2% |
| Interquartile 25% (IQ1) | 2.8% | 1.8% |
| Interquartile 75% (IQ3) | 6.7% | 2.6% |
| Interquartile Range (IQR) | 3.9% | 0.78% |
| Standard Deviation (Sample) | 3.9% | 0.78% |
| Standard Deviation (Population) | 3.9% | 0.77% |
Similar Demographics by Hearing Disability
Demographics Similar to Immigrants from Australia by Hearing Disability
In terms of hearing disability, the demographic groups most similar to Immigrants from Australia are Immigrants from Fiji (2.9%, a difference of 0.020%), Albanian (2.9%, a difference of 0.090%), Immigrants from Japan (2.9%, a difference of 0.11%), Immigrants from Burma/Myanmar (2.9%, a difference of 0.23%), and Immigrants from Kazakhstan (2.9%, a difference of 0.25%).
| Demographics | Rating | Rank | Hearing Disability |
| Immigrants | Lithuania | 73.0 /100 | #152 | Good 2.9% |
| Sudanese | 72.1 /100 | #153 | Good 2.9% |
| Immigrants | Lebanon | 71.5 /100 | #154 | Good 2.9% |
| Costa Ricans | 71.4 /100 | #155 | Good 2.9% |
| Immigrants | Poland | 70.2 /100 | #156 | Good 2.9% |
| Immigrants | Kazakhstan | 69.6 /100 | #157 | Good 2.9% |
| Immigrants | Burma/Myanmar | 69.5 /100 | #158 | Good 2.9% |
| Immigrants | Australia | 67.4 /100 | #159 | Good 2.9% |
| Immigrants | Fiji | 67.1 /100 | #160 | Good 2.9% |
| Albanians | 66.6 /100 | #161 | Good 2.9% |
| Immigrants | Japan | 66.3 /100 | #162 | Good 2.9% |
| Immigrants | Central America | 64.9 /100 | #163 | Good 3.0% |
| Immigrants | Cambodia | 64.8 /100 | #164 | Good 3.0% |
| Immigrants | Zimbabwe | 64.2 /100 | #165 | Good 3.0% |
| Immigrants | South Eastern Asia | 62.9 /100 | #166 | Good 3.0% |
Demographics Similar to Immigrants from India by Hearing Disability
In terms of hearing disability, the demographic groups most similar to Immigrants from India are Immigrants from West Indies (2.5%, a difference of 0.32%), Barbadian (2.5%, a difference of 0.47%), Dominican (2.5%, a difference of 0.69%), Thai (2.5%, a difference of 0.72%), and Ecuadorian (2.5%, a difference of 0.77%).
| Demographics | Rating | Rank | Hearing Disability |
| Immigrants | Ecuador | 99.9 /100 | #10 | Exceptional 2.5% |
| Immigrants | Trinidad and Tobago | 99.9 /100 | #11 | Exceptional 2.5% |
| Trinidadians and Tobagonians | 99.9 /100 | #12 | Exceptional 2.5% |
| Sierra Leoneans | 99.9 /100 | #13 | Exceptional 2.5% |
| Ecuadorians | 99.9 /100 | #14 | Exceptional 2.5% |
| Barbadians | 99.9 /100 | #15 | Exceptional 2.5% |
| Immigrants | West Indies | 99.9 /100 | #16 | Exceptional 2.5% |
| Immigrants | India | 99.9 /100 | #17 | Exceptional 2.5% |
| Dominicans | 99.8 /100 | #18 | Exceptional 2.5% |
| Thais | 99.8 /100 | #19 | Exceptional 2.5% |
| Immigrants | Bolivia | 99.8 /100 | #20 | Exceptional 2.5% |
| Ghanaians | 99.8 /100 | #21 | Exceptional 2.5% |
| Immigrants | Sierra Leone | 99.8 /100 | #22 | Exceptional 2.6% |
| Immigrants | Nigeria | 99.8 /100 | #23 | Exceptional 2.6% |
| Immigrants | Ghana | 99.8 /100 | #24 | Exceptional 2.6% |