Immigrants from Cameroon vs Immigrants from India Hearing Disability
COMPARE
Immigrants from Cameroon
Immigrants from India
Hearing Disability
Hearing Disability Comparison
Immigrants from Cameroon
Immigrants from India
2.6%
HEARING DISABILITY
99.7/ 100
METRIC RATING
31st/ 347
METRIC RANK
2.5%
HEARING DISABILITY
99.9/ 100
METRIC RATING
17th/ 347
METRIC RANK
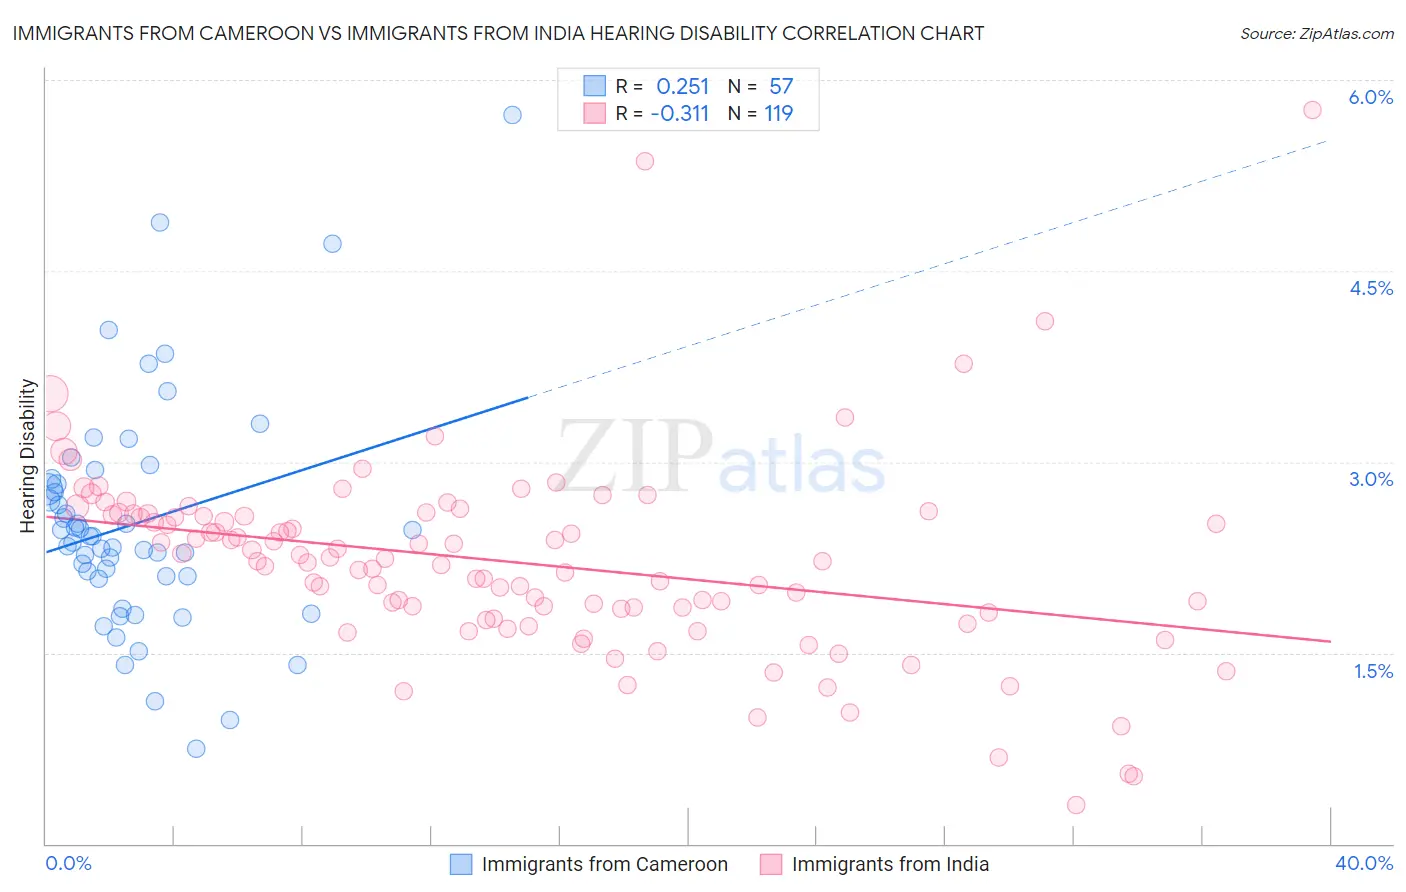
Immigrants from Cameroon vs Immigrants from India Hearing Disability Correlation Chart
The statistical analysis conducted on geographies consisting of 130,730,708 people shows a weak positive correlation between the proportion of Immigrants from Cameroon and percentage of population with hearing disability in the United States with a correlation coefficient (R) of 0.251 and weighted average of 2.6%. Similarly, the statistical analysis conducted on geographies consisting of 433,914,336 people shows a mild negative correlation between the proportion of Immigrants from India and percentage of population with hearing disability in the United States with a correlation coefficient (R) of -0.311 and weighted average of 2.5%, a difference of 2.6%.
Hearing Disability Correlation Summary
| Measurement | Immigrants from Cameroon | Immigrants from India |
| Minimum | 0.75% | 0.30% |
| Maximum | 5.7% | 5.8% |
| Range | 5.0% | 5.5% |
| Mean | 2.5% | 2.2% |
| Median | 2.4% | 2.2% |
| Interquartile 25% (IQ1) | 2.1% | 1.8% |
| Interquartile 75% (IQ3) | 2.8% | 2.6% |
| Interquartile Range (IQR) | 0.75% | 0.78% |
| Standard Deviation (Sample) | 0.91% | 0.78% |
| Standard Deviation (Population) | 0.90% | 0.77% |
Demographics Similar to Immigrants from Cameroon and Immigrants from India by Hearing Disability
In terms of hearing disability, the demographic groups most similar to Immigrants from Cameroon are Immigrants from Caribbean (2.6%, a difference of 0.010%), Bolivian (2.6%, a difference of 0.090%), Immigrants from Haiti (2.6%, a difference of 0.11%), Immigrants from Venezuela (2.6%, a difference of 0.14%), and Filipino (2.6%, a difference of 0.40%). Similarly, the demographic groups most similar to Immigrants from India are Immigrants from West Indies (2.5%, a difference of 0.32%), Barbadian (2.5%, a difference of 0.47%), Dominican (2.5%, a difference of 0.69%), Thai (2.5%, a difference of 0.72%), and Ecuadorian (2.5%, a difference of 0.77%).
| Demographics | Rating | Rank | Hearing Disability |
| Ecuadorians | 99.9 /100 | #14 | Exceptional 2.5% |
| Barbadians | 99.9 /100 | #15 | Exceptional 2.5% |
| Immigrants | West Indies | 99.9 /100 | #16 | Exceptional 2.5% |
| Immigrants | India | 99.9 /100 | #17 | Exceptional 2.5% |
| Dominicans | 99.8 /100 | #18 | Exceptional 2.5% |
| Thais | 99.8 /100 | #19 | Exceptional 2.5% |
| Immigrants | Bolivia | 99.8 /100 | #20 | Exceptional 2.5% |
| Ghanaians | 99.8 /100 | #21 | Exceptional 2.5% |
| Immigrants | Sierra Leone | 99.8 /100 | #22 | Exceptional 2.6% |
| Immigrants | Nigeria | 99.8 /100 | #23 | Exceptional 2.6% |
| Immigrants | Ghana | 99.8 /100 | #24 | Exceptional 2.6% |
| Immigrants | El Salvador | 99.7 /100 | #25 | Exceptional 2.6% |
| Immigrants | Senegal | 99.7 /100 | #26 | Exceptional 2.6% |
| Immigrants | South Central Asia | 99.7 /100 | #27 | Exceptional 2.6% |
| Immigrants | Haiti | 99.7 /100 | #28 | Exceptional 2.6% |
| Bolivians | 99.7 /100 | #29 | Exceptional 2.6% |
| Immigrants | Caribbean | 99.7 /100 | #30 | Exceptional 2.6% |
| Immigrants | Cameroon | 99.7 /100 | #31 | Exceptional 2.6% |
| Immigrants | Venezuela | 99.7 /100 | #32 | Exceptional 2.6% |
| Filipinos | 99.6 /100 | #33 | Exceptional 2.6% |
| Immigrants | Pakistan | 99.6 /100 | #34 | Exceptional 2.6% |