Guamanian/Chamorro vs American Disability Age 35 to 64
COMPARE
Guamanian/Chamorro
American
Disability Age 35 to 64
Disability Age 35 to 64 Comparison
Guamanians/Chamorros
Americans
12.2%
DISABILITY AGE 35 TO 64
1.4/ 100
METRIC RATING
246th/ 347
METRIC RANK
13.9%
DISABILITY AGE 35 TO 64
0.0/ 100
METRIC RATING
305th/ 347
METRIC RANK
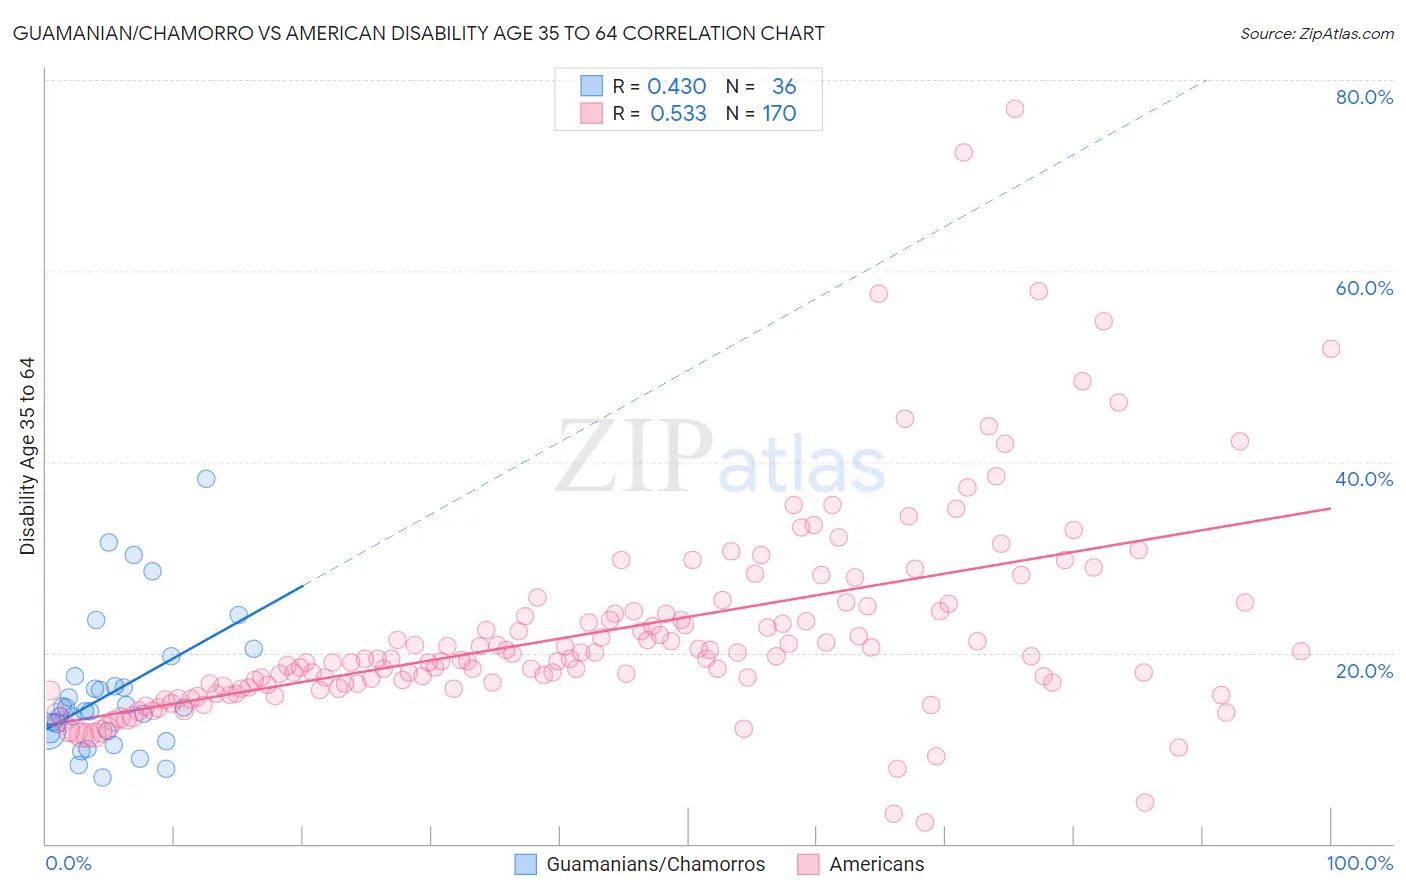
Guamanian/Chamorro vs American Disability Age 35 to 64 Correlation Chart
The statistical analysis conducted on geographies consisting of 221,858,951 people shows a moderate positive correlation between the proportion of Guamanians/Chamorros and percentage of population with a disability between the ages 34 and 64 in the United States with a correlation coefficient (R) of 0.430 and weighted average of 12.2%. Similarly, the statistical analysis conducted on geographies consisting of 580,759,751 people shows a substantial positive correlation between the proportion of Americans and percentage of population with a disability between the ages 34 and 64 in the United States with a correlation coefficient (R) of 0.533 and weighted average of 13.9%, a difference of 13.7%.
Disability Age 35 to 64 Correlation Summary
| Measurement | Guamanian/Chamorro | American |
| Minimum | 7.0% | 2.3% |
| Maximum | 38.2% | 76.9% |
| Range | 31.2% | 74.7% |
| Mean | 15.9% | 22.2% |
| Median | 14.1% | 19.4% |
| Interquartile 25% (IQ1) | 11.7% | 16.3% |
| Interquartile 75% (IQ3) | 17.0% | 24.3% |
| Interquartile Range (IQR) | 5.3% | 8.0% |
| Standard Deviation (Sample) | 7.1% | 11.0% |
| Standard Deviation (Population) | 7.0% | 11.0% |
Similar Demographics by Disability Age 35 to 64
Demographics Similar to Guamanians/Chamorros by Disability Age 35 to 64
In terms of disability age 35 to 64, the demographic groups most similar to Guamanians/Chamorros are Immigrants from Senegal (12.2%, a difference of 0.040%), Spaniard (12.3%, a difference of 0.13%), Hispanic or Latino (12.3%, a difference of 0.16%), Immigrants from Burma/Myanmar (12.3%, a difference of 0.29%), and German (12.3%, a difference of 0.37%).
| Demographics | Rating | Rank | Disability Age 35 to 64 |
| Immigrants | Western Africa | 3.3 /100 | #239 | Tragic 12.0% |
| Immigrants | Thailand | 3.3 /100 | #240 | Tragic 12.0% |
| Mexican American Indians | 3.2 /100 | #241 | Tragic 12.0% |
| Samoans | 2.8 /100 | #242 | Tragic 12.1% |
| Slovaks | 2.7 /100 | #243 | Tragic 12.1% |
| Finns | 2.3 /100 | #244 | Tragic 12.1% |
| Immigrants | Mexico | 2.2 /100 | #245 | Tragic 12.1% |
| Guamanians/Chamorros | 1.4 /100 | #246 | Tragic 12.2% |
| Immigrants | Senegal | 1.3 /100 | #247 | Tragic 12.2% |
| Spaniards | 1.3 /100 | #248 | Tragic 12.3% |
| Hispanics or Latinos | 1.3 /100 | #249 | Tragic 12.3% |
| Immigrants | Burma/Myanmar | 1.2 /100 | #250 | Tragic 12.3% |
| Germans | 1.1 /100 | #251 | Tragic 12.3% |
| Irish | 1.0 /100 | #252 | Tragic 12.3% |
| Dutch | 1.0 /100 | #253 | Tragic 12.3% |
Demographics Similar to Americans by Disability Age 35 to 64
In terms of disability age 35 to 64, the demographic groups most similar to Americans are Hopi (13.9%, a difference of 0.38%), Sioux (13.9%, a difference of 0.41%), Aleut (13.8%, a difference of 0.59%), Immigrants from Yemen (14.0%, a difference of 0.87%), and Blackfeet (14.1%, a difference of 1.0%).
| Demographics | Rating | Rank | Disability Age 35 to 64 |
| Cheyenne | 0.0 /100 | #298 | Tragic 13.6% |
| Spanish Americans | 0.0 /100 | #299 | Tragic 13.7% |
| Delaware | 0.0 /100 | #300 | Tragic 13.7% |
| French American Indians | 0.0 /100 | #301 | Tragic 13.7% |
| Aleuts | 0.0 /100 | #302 | Tragic 13.8% |
| Sioux | 0.0 /100 | #303 | Tragic 13.9% |
| Hopi | 0.0 /100 | #304 | Tragic 13.9% |
| Americans | 0.0 /100 | #305 | Tragic 13.9% |
| Immigrants | Yemen | 0.0 /100 | #306 | Tragic 14.0% |
| Blackfeet | 0.0 /100 | #307 | Tragic 14.1% |
| Inupiat | 0.0 /100 | #308 | Tragic 14.1% |
| Cree | 0.0 /100 | #309 | Tragic 14.1% |
| Cape Verdeans | 0.0 /100 | #310 | Tragic 14.1% |
| Immigrants | Azores | 0.0 /100 | #311 | Tragic 14.3% |
| Paiute | 0.0 /100 | #312 | Tragic 14.3% |