Ghanaian vs Czech Male Disability
COMPARE
Ghanaian
Czech
Male Disability
Male Disability Comparison
Ghanaians
Czechs
10.8%
MALE DISABILITY
93.4/ 100
METRIC RATING
112th/ 347
METRIC RANK
11.9%
MALE DISABILITY
1.1/ 100
METRIC RATING
240th/ 347
METRIC RANK
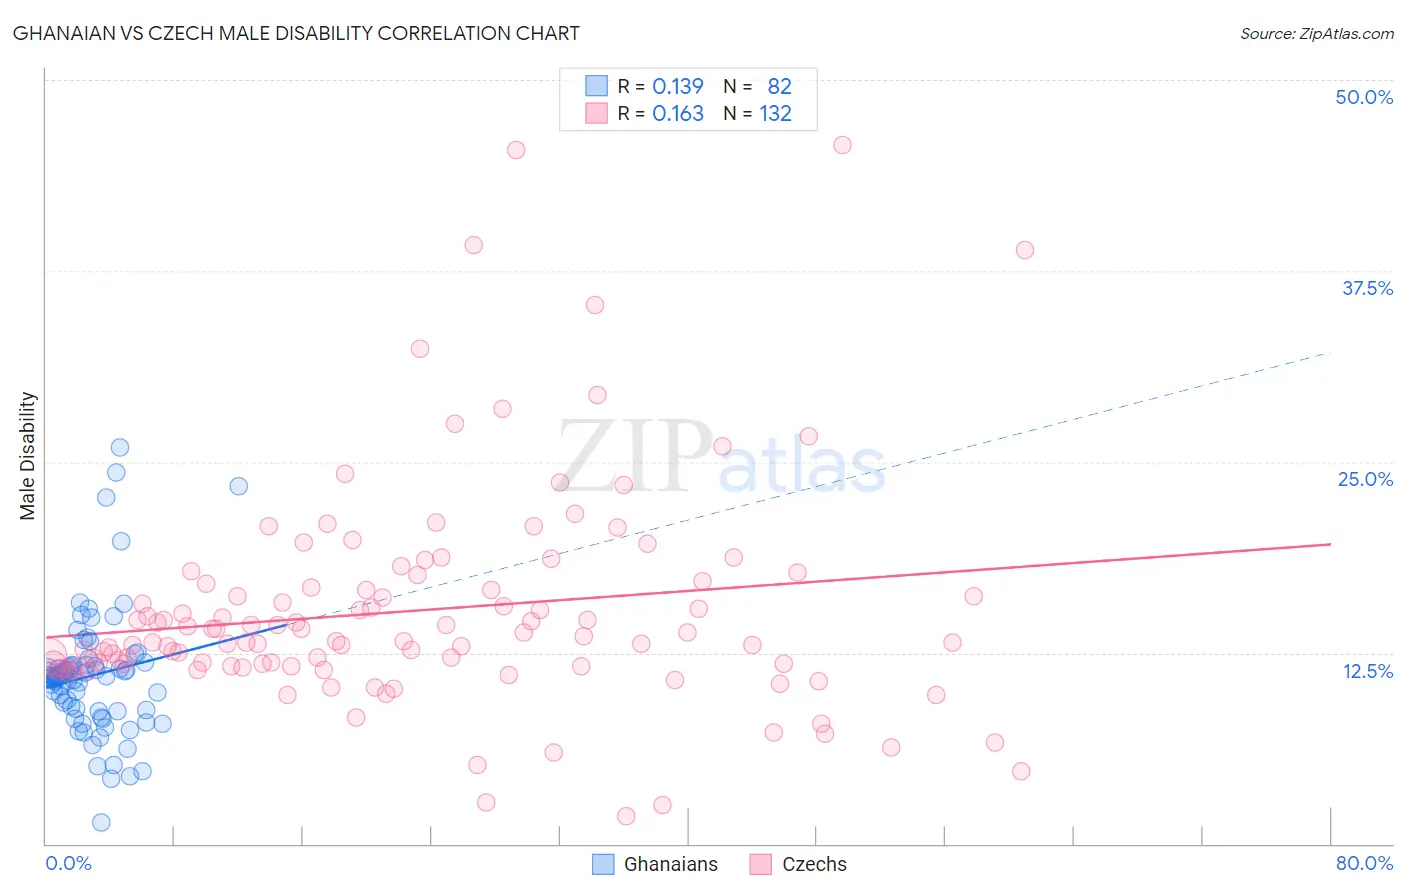
Ghanaian vs Czech Male Disability Correlation Chart
The statistical analysis conducted on geographies consisting of 190,687,278 people shows a poor positive correlation between the proportion of Ghanaians and percentage of males with a disability in the United States with a correlation coefficient (R) of 0.139 and weighted average of 10.8%. Similarly, the statistical analysis conducted on geographies consisting of 484,720,527 people shows a poor positive correlation between the proportion of Czechs and percentage of males with a disability in the United States with a correlation coefficient (R) of 0.163 and weighted average of 11.9%, a difference of 10.2%.
Male Disability Correlation Summary
| Measurement | Ghanaian | Czech |
| Minimum | 1.4% | 1.8% |
| Maximum | 25.9% | 45.8% |
| Range | 24.5% | 44.0% |
| Mean | 11.0% | 15.3% |
| Median | 11.0% | 13.3% |
| Interquartile 25% (IQ1) | 8.7% | 11.6% |
| Interquartile 75% (IQ3) | 11.7% | 16.9% |
| Interquartile Range (IQR) | 3.0% | 5.3% |
| Standard Deviation (Sample) | 4.2% | 7.2% |
| Standard Deviation (Population) | 4.1% | 7.2% |
Similar Demographics by Male Disability
Demographics Similar to Ghanaians by Male Disability
In terms of male disability, the demographic groups most similar to Ghanaians are Immigrants from Zimbabwe (10.8%, a difference of 0.090%), Immigrants from Uruguay (10.8%, a difference of 0.10%), Immigrants (10.8%, a difference of 0.14%), Central American (10.8%, a difference of 0.15%), and Immigrants from Uganda (10.8%, a difference of 0.16%).
| Demographics | Rating | Rank | Male Disability |
| Immigrants | Brazil | 95.0 /100 | #105 | Exceptional 10.8% |
| Immigrants | Syria | 94.9 /100 | #106 | Exceptional 10.8% |
| Immigrants | Eastern Africa | 94.3 /100 | #107 | Exceptional 10.8% |
| Immigrants | Belgium | 94.2 /100 | #108 | Exceptional 10.8% |
| Immigrants | Uganda | 94.0 /100 | #109 | Exceptional 10.8% |
| Immigrants | Immigrants | 93.9 /100 | #110 | Exceptional 10.8% |
| Immigrants | Uruguay | 93.8 /100 | #111 | Exceptional 10.8% |
| Ghanaians | 93.4 /100 | #112 | Exceptional 10.8% |
| Immigrants | Zimbabwe | 93.0 /100 | #113 | Exceptional 10.8% |
| Central Americans | 92.7 /100 | #114 | Exceptional 10.8% |
| Immigrants | Barbados | 92.2 /100 | #115 | Exceptional 10.8% |
| Immigrants | South Africa | 91.8 /100 | #116 | Exceptional 10.8% |
| Eastern Europeans | 90.6 /100 | #117 | Exceptional 10.9% |
| Immigrants | Cuba | 90.2 /100 | #118 | Exceptional 10.9% |
| Armenians | 90.1 /100 | #119 | Exceptional 10.9% |
Demographics Similar to Czechs by Male Disability
In terms of male disability, the demographic groups most similar to Czechs are Bahamian (11.9%, a difference of 0.040%), Italian (11.9%, a difference of 0.050%), Northern European (11.9%, a difference of 0.050%), Samoan (11.9%, a difference of 0.080%), and Yugoslavian (11.9%, a difference of 0.10%).
| Demographics | Rating | Rank | Male Disability |
| Mexicans | 1.7 /100 | #233 | Tragic 11.8% |
| Immigrants | Canada | 1.6 /100 | #234 | Tragic 11.9% |
| Immigrants | North America | 1.5 /100 | #235 | Tragic 11.9% |
| U.S. Virgin Islanders | 1.3 /100 | #236 | Tragic 11.9% |
| Carpatho Rusyns | 1.3 /100 | #237 | Tragic 11.9% |
| Yugoslavians | 1.2 /100 | #238 | Tragic 11.9% |
| Italians | 1.2 /100 | #239 | Tragic 11.9% |
| Czechs | 1.1 /100 | #240 | Tragic 11.9% |
| Bahamians | 1.1 /100 | #241 | Tragic 11.9% |
| Northern Europeans | 1.1 /100 | #242 | Tragic 11.9% |
| Samoans | 1.1 /100 | #243 | Tragic 11.9% |
| Immigrants | Laos | 1.0 /100 | #244 | Tragic 11.9% |
| Immigrants | Liberia | 1.0 /100 | #245 | Tragic 11.9% |
| Danes | 0.9 /100 | #246 | Tragic 11.9% |
| Hungarians | 0.8 /100 | #247 | Tragic 12.0% |