German Russian vs Japanese Vision Disability
COMPARE
German Russian
Japanese
Vision Disability
Vision Disability Comparison
German Russians
Japanese
2.3%
VISION DISABILITY
1.8/ 100
METRIC RATING
232nd/ 347
METRIC RANK
2.4%
VISION DISABILITY
0.3/ 100
METRIC RATING
253rd/ 347
METRIC RANK
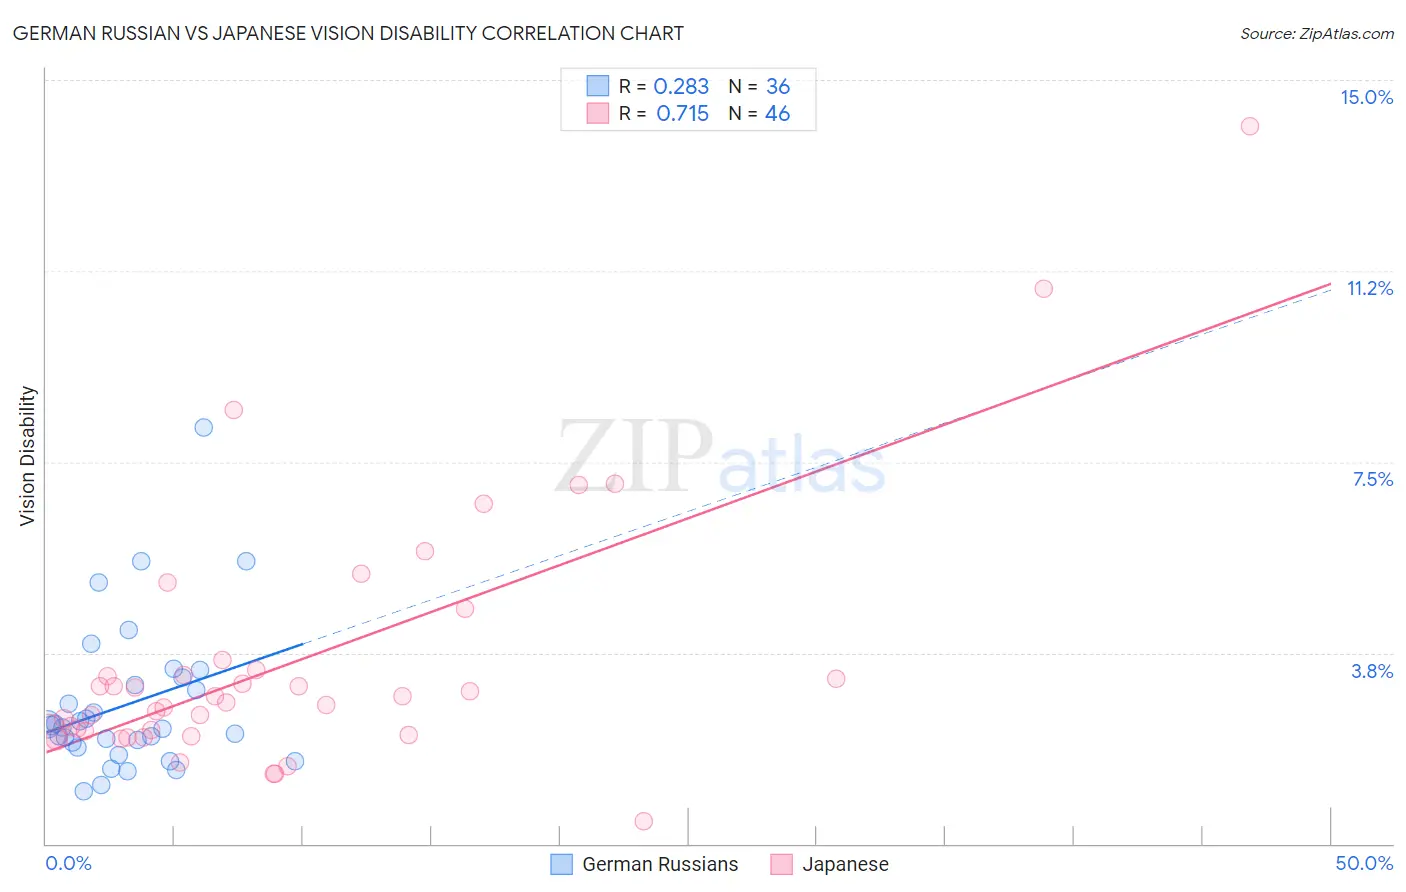
German Russian vs Japanese Vision Disability Correlation Chart
The statistical analysis conducted on geographies consisting of 96,448,558 people shows a weak positive correlation between the proportion of German Russians and percentage of population with vision disability in the United States with a correlation coefficient (R) of 0.283 and weighted average of 2.3%. Similarly, the statistical analysis conducted on geographies consisting of 249,077,012 people shows a strong positive correlation between the proportion of Japanese and percentage of population with vision disability in the United States with a correlation coefficient (R) of 0.715 and weighted average of 2.4%, a difference of 2.5%.
Vision Disability Correlation Summary
| Measurement | German Russian | Japanese |
| Minimum | 1.0% | 0.43% |
| Maximum | 8.2% | 14.1% |
| Range | 7.1% | 13.7% |
| Mean | 2.7% | 3.6% |
| Median | 2.3% | 2.8% |
| Interquartile 25% (IQ1) | 1.9% | 2.2% |
| Interquartile 75% (IQ3) | 3.2% | 3.4% |
| Interquartile Range (IQR) | 1.2% | 1.2% |
| Standard Deviation (Sample) | 1.5% | 2.6% |
| Standard Deviation (Population) | 1.4% | 2.5% |
Similar Demographics by Vision Disability
Demographics Similar to German Russians by Vision Disability
In terms of vision disability, the demographic groups most similar to German Russians are Central American (2.3%, a difference of 0.020%), Immigrants from Ecuador (2.3%, a difference of 0.19%), Scottish (2.3%, a difference of 0.20%), Marshallese (2.3%, a difference of 0.27%), and Nicaraguan (2.3%, a difference of 0.35%).
| Demographics | Rating | Rank | Vision Disability |
| Immigrants | Western Africa | 3.4 /100 | #225 | Tragic 2.3% |
| Immigrants | Germany | 3.0 /100 | #226 | Tragic 2.3% |
| Hawaiians | 2.9 /100 | #227 | Tragic 2.3% |
| Hmong | 2.5 /100 | #228 | Tragic 2.3% |
| Welsh | 2.3 /100 | #229 | Tragic 2.3% |
| Nicaraguans | 2.2 /100 | #230 | Tragic 2.3% |
| Immigrants | Ecuador | 2.0 /100 | #231 | Tragic 2.3% |
| German Russians | 1.8 /100 | #232 | Tragic 2.3% |
| Central Americans | 1.8 /100 | #233 | Tragic 2.3% |
| Scottish | 1.6 /100 | #234 | Tragic 2.3% |
| Marshallese | 1.5 /100 | #235 | Tragic 2.3% |
| Immigrants | Congo | 1.4 /100 | #236 | Tragic 2.3% |
| Immigrants | Portugal | 1.4 /100 | #237 | Tragic 2.3% |
| Immigrants | Cambodia | 1.1 /100 | #238 | Tragic 2.3% |
| English | 1.1 /100 | #239 | Tragic 2.3% |
Demographics Similar to Japanese by Vision Disability
In terms of vision disability, the demographic groups most similar to Japanese are Immigrants from Micronesia (2.4%, a difference of 0.070%), Haitian (2.4%, a difference of 0.28%), Immigrants from Guatemala (2.4%, a difference of 0.31%), Immigrants from Laos (2.4%, a difference of 0.39%), and Bangladeshi (2.3%, a difference of 0.50%).
| Demographics | Rating | Rank | Vision Disability |
| French | 0.5 /100 | #246 | Tragic 2.3% |
| Guatemalans | 0.5 /100 | #247 | Tragic 2.3% |
| Sub-Saharan Africans | 0.5 /100 | #248 | Tragic 2.3% |
| Liberians | 0.5 /100 | #249 | Tragic 2.3% |
| Bangladeshis | 0.5 /100 | #250 | Tragic 2.3% |
| Immigrants | Laos | 0.4 /100 | #251 | Tragic 2.4% |
| Immigrants | Micronesia | 0.3 /100 | #252 | Tragic 2.4% |
| Japanese | 0.3 /100 | #253 | Tragic 2.4% |
| Haitians | 0.3 /100 | #254 | Tragic 2.4% |
| Immigrants | Guatemala | 0.3 /100 | #255 | Tragic 2.4% |
| Immigrants | Haiti | 0.2 /100 | #256 | Tragic 2.4% |
| West Indians | 0.2 /100 | #257 | Tragic 2.4% |
| British West Indians | 0.2 /100 | #258 | Tragic 2.4% |
| Whites/Caucasians | 0.2 /100 | #259 | Tragic 2.4% |
| Belizeans | 0.2 /100 | #260 | Tragic 2.4% |